| __timestamp | Gen Digital Inc. | Intuit Inc. |
|---|---|---|
| Wednesday, January 1, 2014 | 5527000000 | 3838000000 |
| Thursday, January 1, 2015 | 5355000000 | 3467000000 |
| Friday, January 1, 2016 | 2985000000 | 3942000000 |
| Sunday, January 1, 2017 | 3166000000 | 4368000000 |
| Monday, January 1, 2018 | 3814000000 | 4987000000 |
| Tuesday, January 1, 2019 | 3681000000 | 5617000000 |
| Wednesday, January 1, 2020 | 2097000000 | 6301000000 |
| Friday, January 1, 2021 | 2189000000 | 7950000000 |
| Saturday, January 1, 2022 | 2388000000 | 10320000000 |
| Sunday, January 1, 2023 | 2749000000 | 11225000000 |
| Monday, January 1, 2024 | 3081000000 | 12820000000 |
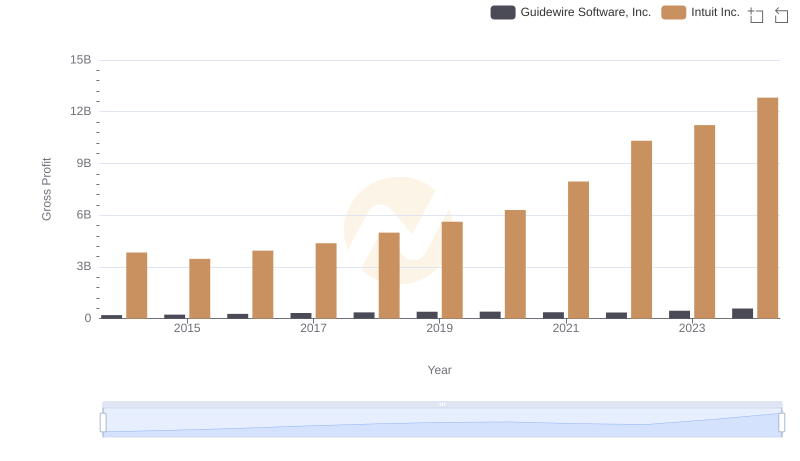
Data in motion
In the ever-evolving landscape of financial technology and digital solutions, Intuit Inc. and Gen Digital Inc. have emerged as key players. Over the past decade, from 2014 to 2024, these companies have showcased contrasting trajectories in their gross profit performance. Intuit Inc. has demonstrated a robust growth pattern, with its gross profit surging by approximately 234%, from around $3.8 billion in 2014 to an impressive $12.8 billion in 2024. This growth underscores Intuit's strategic prowess in capitalizing on market opportunities and expanding its product offerings.
Conversely, Gen Digital Inc. experienced a more volatile journey. Starting with a peak gross profit of $5.5 billion in 2014, the company faced fluctuations, reaching a low of $2.1 billion in 2020. However, a recovery is evident, with profits rebounding to $3.1 billion by 2024. This performance highlights the challenges and resilience in the digital sector.
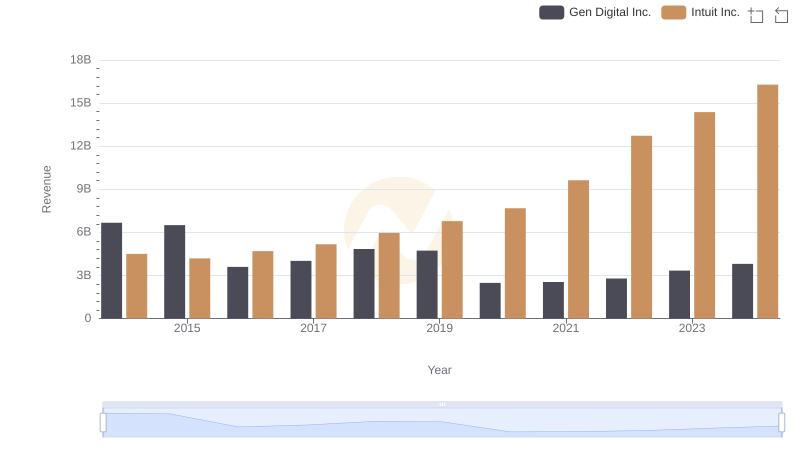
Intuit Inc. or Gen Digital Inc.: Who Leads in Yearly Revenue?
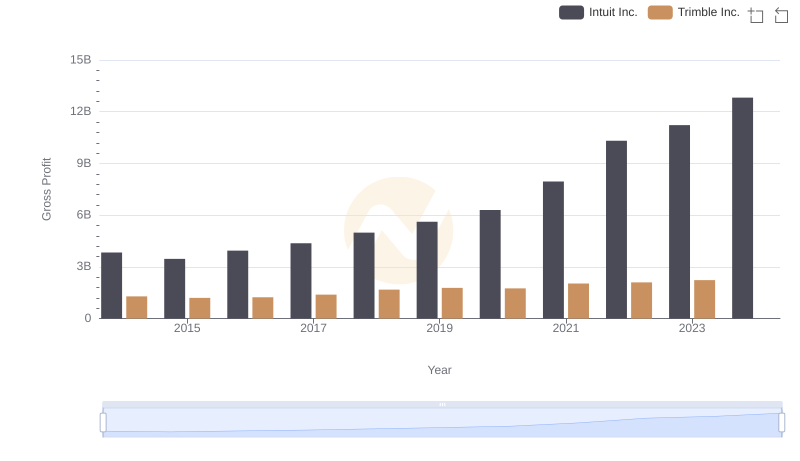
Key Insights on Gross Profit: Intuit Inc. vs Trimble Inc.
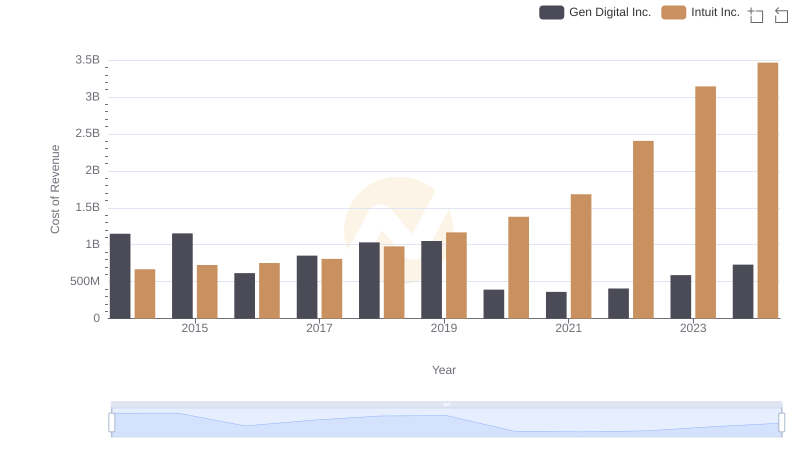
Comparing Cost of Revenue Efficiency: Intuit Inc. vs Gen Digital Inc.
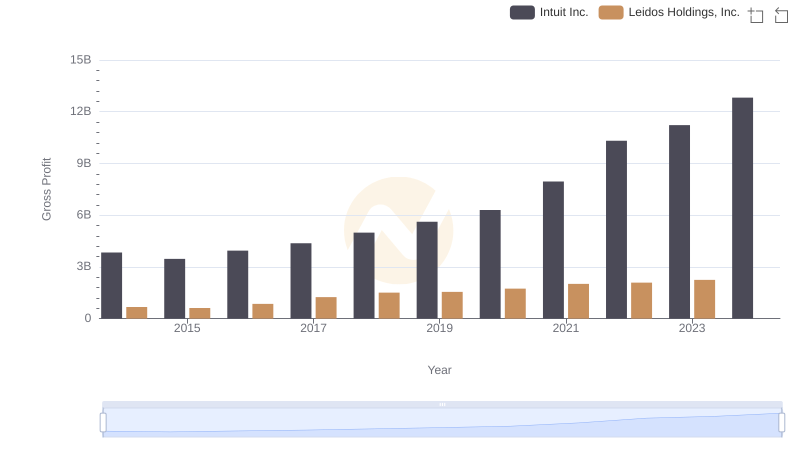
Intuit Inc. and Leidos Holdings, Inc.: A Detailed Gross Profit Analysis
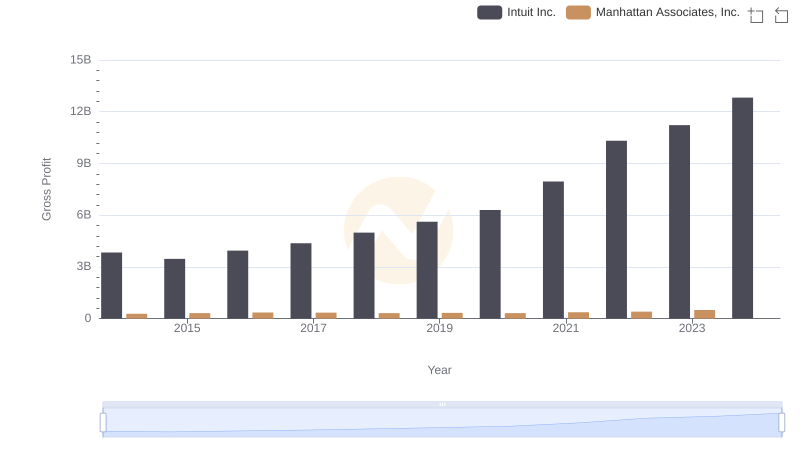
Gross Profit Trends Compared: Intuit Inc. vs Manhattan Associates, Inc.
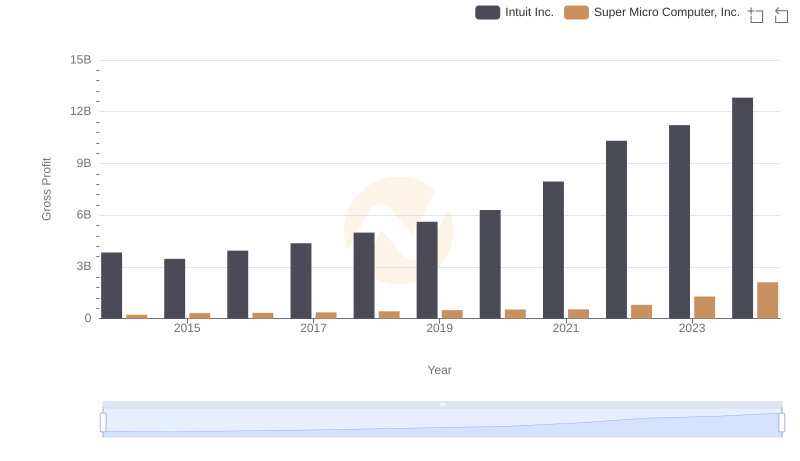
Gross Profit Analysis: Comparing Intuit Inc. and Super Micro Computer, Inc.
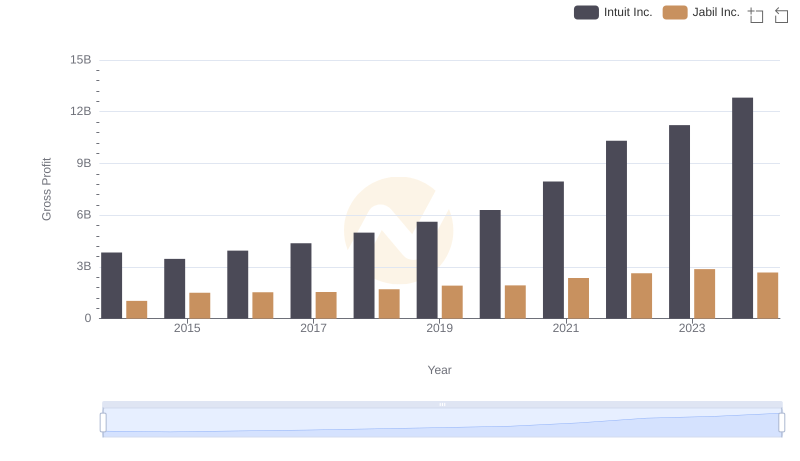
Gross Profit Trends Compared: Intuit Inc. vs Jabil Inc.
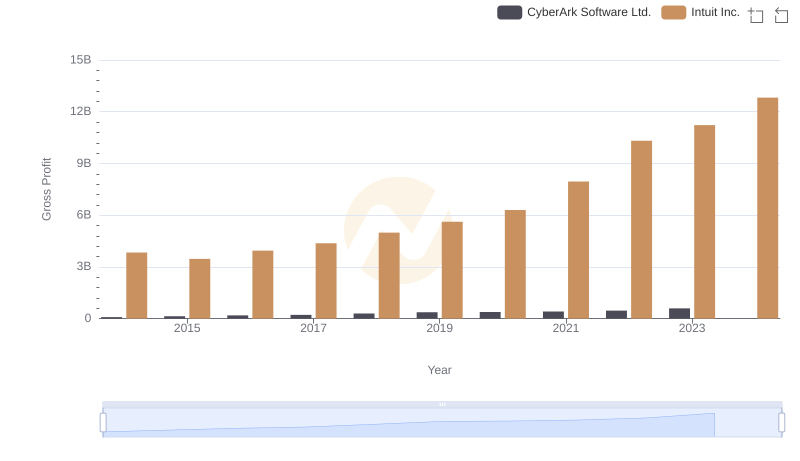
Gross Profit Analysis: Comparing Intuit Inc. and CyberArk Software Ltd.
Gross Profit Analysis: Comparing Intuit Inc. and Guidewire Software, Inc.
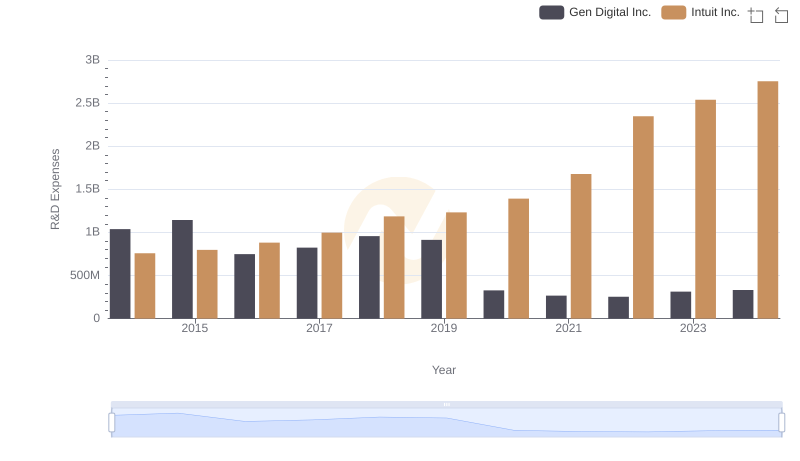
Research and Development Investment: Intuit Inc. vs Gen Digital Inc.
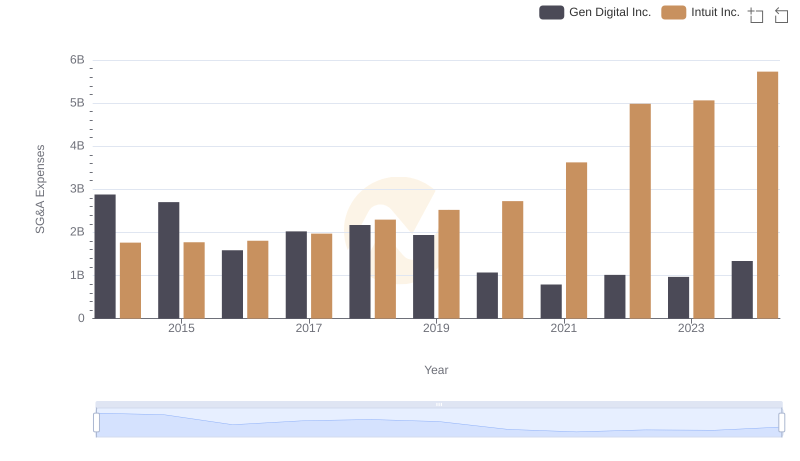
Breaking Down SG&A Expenses: Intuit Inc. vs Gen Digital Inc.
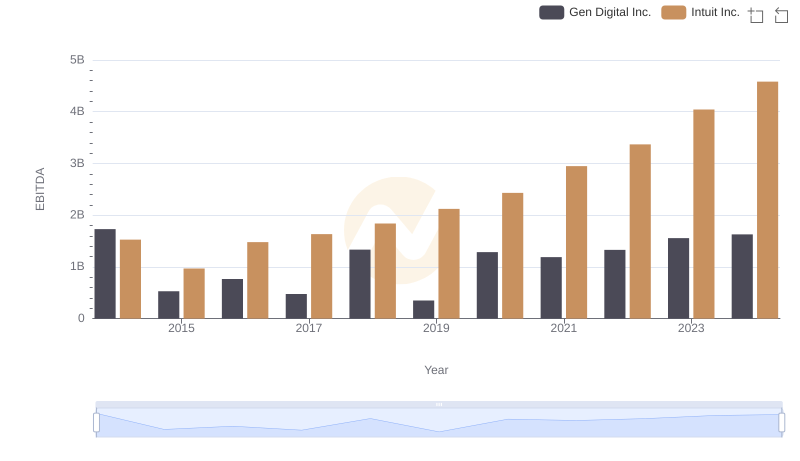
EBITDA Metrics Evaluated: Intuit Inc. vs Gen Digital Inc.