| __timestamp | Intuit Inc. | VeriSign, Inc. |
|---|---|---|
| Wednesday, January 1, 2014 | 3838000000 | 821692000 |
| Thursday, January 1, 2015 | 3467000000 | 866578000 |
| Friday, January 1, 2016 | 3942000000 | 943925000 |
| Sunday, January 1, 2017 | 4368000000 | 971769000 |
| Monday, January 1, 2018 | 4987000000 | 1022835000 |
| Tuesday, January 1, 2019 | 5617000000 | 1051194000 |
| Wednesday, January 1, 2020 | 6301000000 | 1084875000 |
| Friday, January 1, 2021 | 7950000000 | 1135643000 |
| Saturday, January 1, 2022 | 10320000000 | 1224200000 |
| Sunday, January 1, 2023 | 11225000000 | 1295800000 |
| Monday, January 1, 2024 | 12820000000 | 1366000000 |
Igniting the spark of knowledge
In the ever-evolving landscape of technology, financial performance is a key indicator of a company's resilience and growth. This chart provides a fascinating glimpse into the gross profit trends of two tech giants, Intuit Inc. and VeriSign, Inc., from 2014 to 2023. Over this decade, Intuit Inc. has demonstrated a remarkable growth trajectory, with its gross profit surging by approximately 234%, from $3.8 billion in 2014 to an impressive $12.8 billion in 2023. In contrast, VeriSign, Inc. has shown a steady, albeit more modest, increase of around 58%, reaching $1.3 billion in 2023. This comparison highlights Intuit's aggressive expansion and market dominance, while VeriSign maintains a stable yet slower growth pace. Notably, data for VeriSign in 2024 is missing, leaving room for speculation on its future performance.
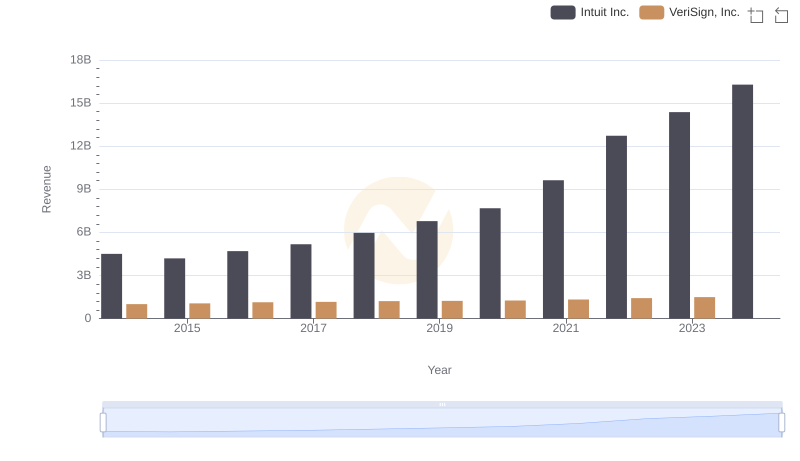
Who Generates More Revenue? Intuit Inc. or VeriSign, Inc.
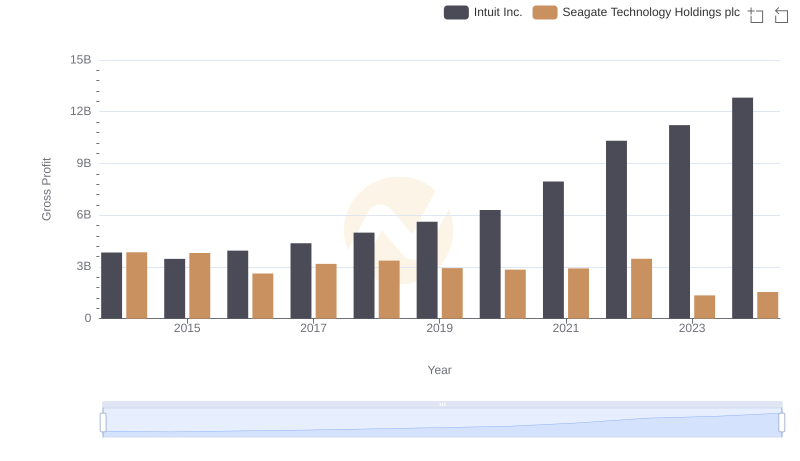
Gross Profit Analysis: Comparing Intuit Inc. and Seagate Technology Holdings plc
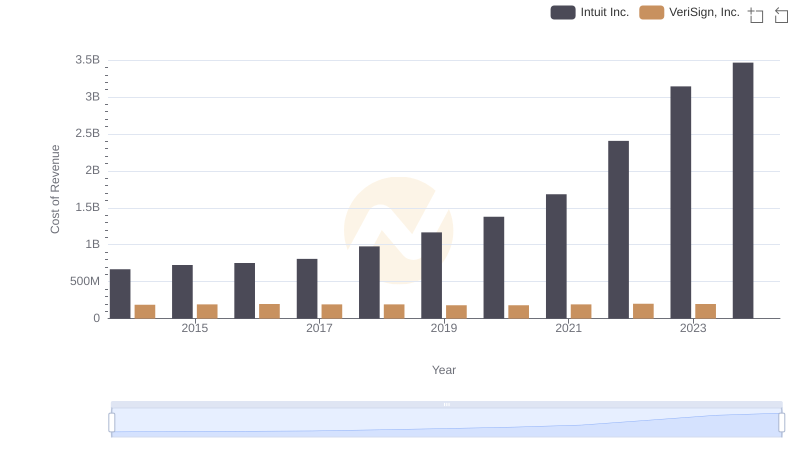
Comparing Cost of Revenue Efficiency: Intuit Inc. vs VeriSign, Inc.
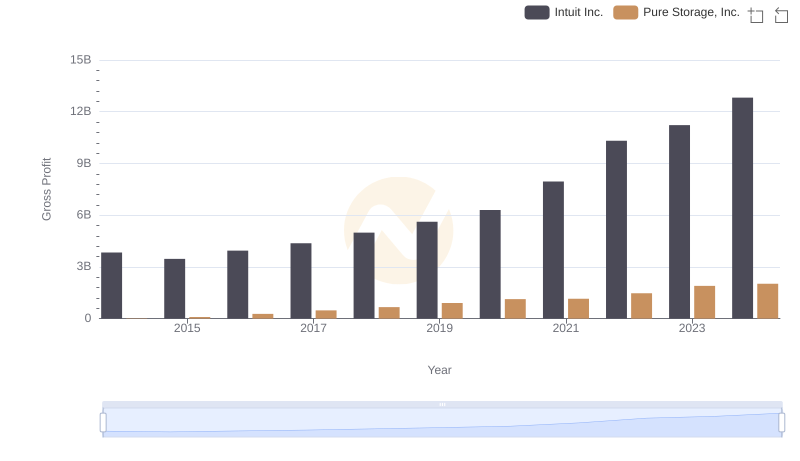
Intuit Inc. vs Pure Storage, Inc.: A Gross Profit Performance Breakdown
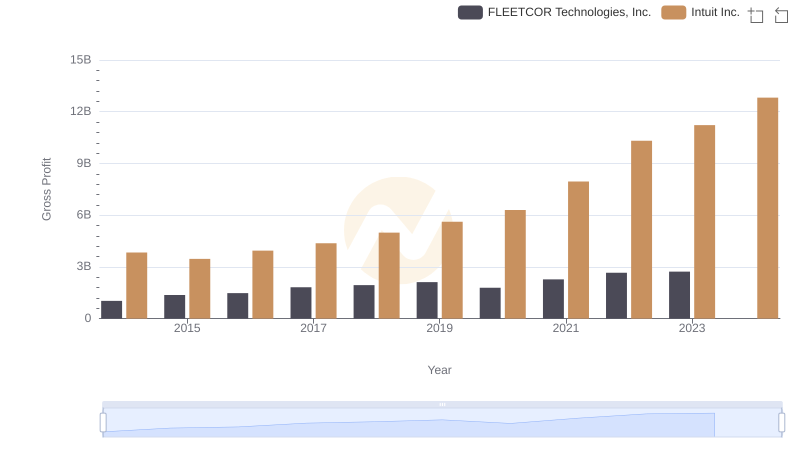
Gross Profit Trends Compared: Intuit Inc. vs FLEETCOR Technologies, Inc.
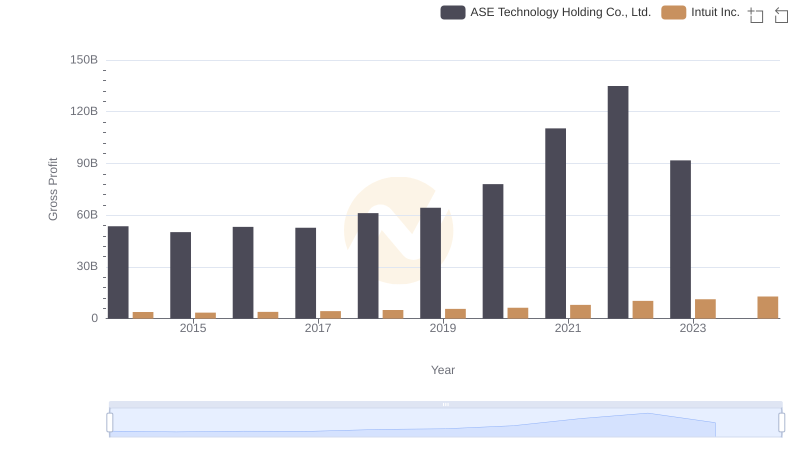
Intuit Inc. vs ASE Technology Holding Co., Ltd.: A Gross Profit Performance Breakdown
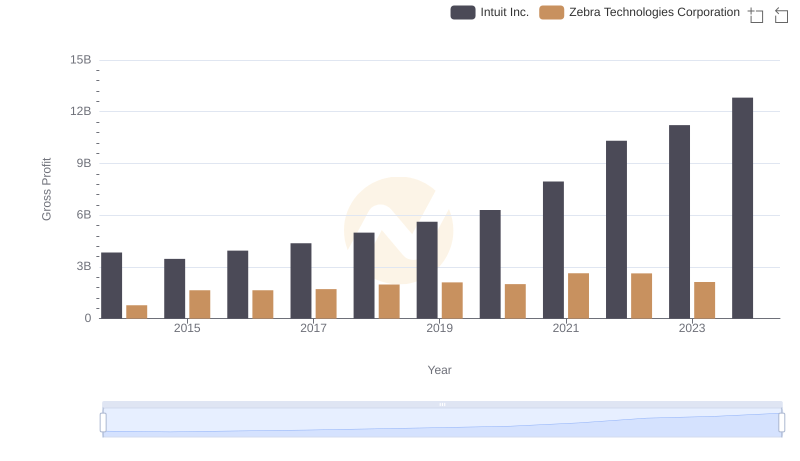
Who Generates Higher Gross Profit? Intuit Inc. or Zebra Technologies Corporation
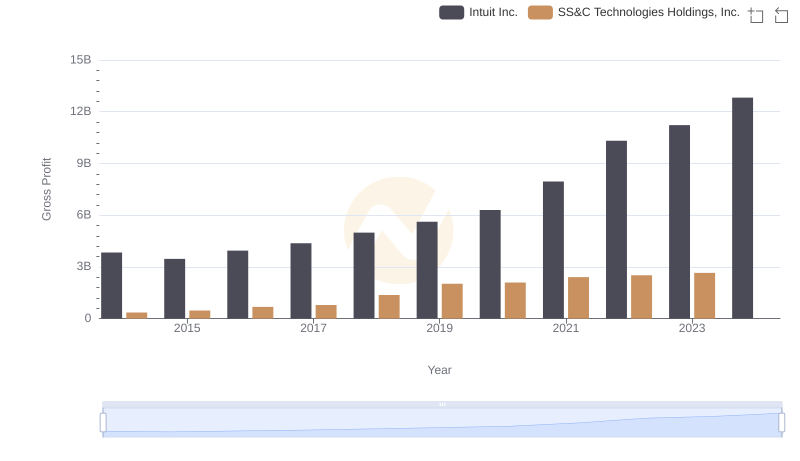
Gross Profit Comparison: Intuit Inc. and SS&C Technologies Holdings, Inc. Trends
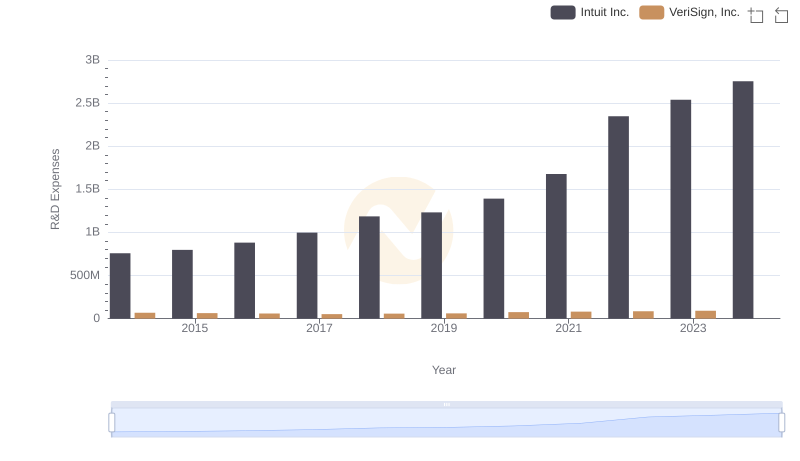
R&D Spending Showdown: Intuit Inc. vs VeriSign, Inc.
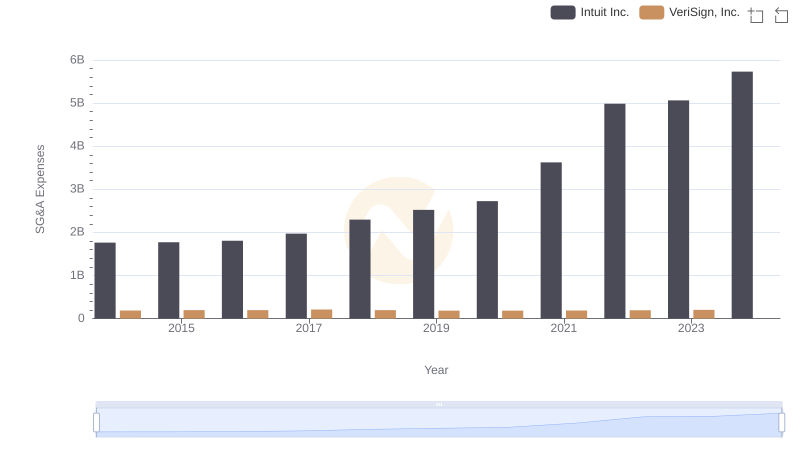
Intuit Inc. vs VeriSign, Inc.: SG&A Expense Trends
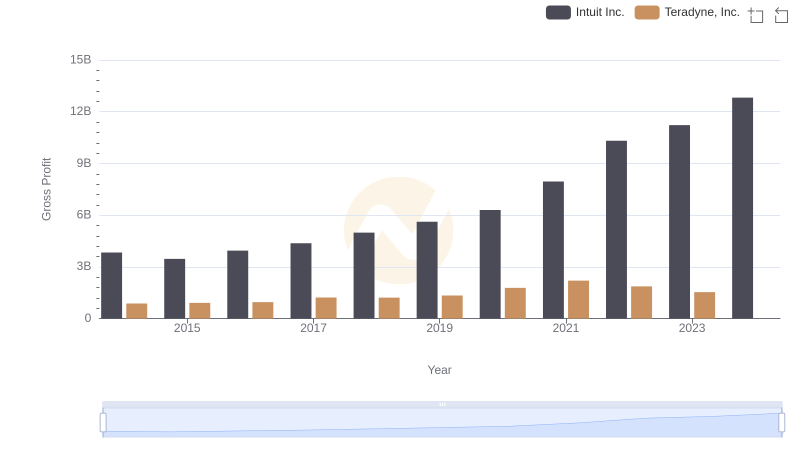
Gross Profit Analysis: Comparing Intuit Inc. and Teradyne, Inc.
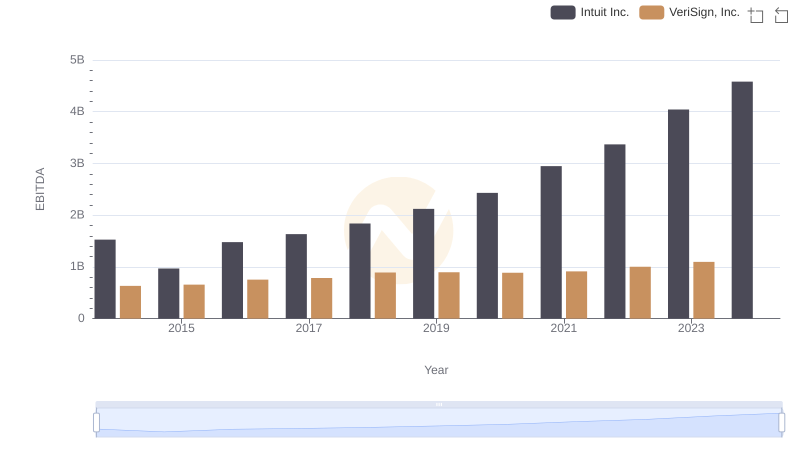
Professional EBITDA Benchmarking: Intuit Inc. vs VeriSign, Inc.