| __timestamp | Intuit Inc. | Teradyne, Inc. |
|---|---|---|
| Wednesday, January 1, 2014 | 1528000000 | 355804000 |
| Thursday, January 1, 2015 | 970000000 | 390438000 |
| Friday, January 1, 2016 | 1480000000 | 68085999 |
| Sunday, January 1, 2017 | 1634000000 | 647992000 |
| Monday, January 1, 2018 | 1839000000 | 603746000 |
| Tuesday, January 1, 2019 | 2121000000 | 650398000 |
| Wednesday, January 1, 2020 | 2430000000 | 1036119000 |
| Friday, January 1, 2021 | 2948000000 | 1291304000 |
| Saturday, January 1, 2022 | 3369000000 | 954200000 |
| Sunday, January 1, 2023 | 4043000000 | 640495000 |
| Monday, January 1, 2024 | 4581000000 | 593788000 |
Unleashing the power of data
In the ever-evolving landscape of technology and finance, Intuit Inc. and Teradyne, Inc. have carved distinct paths over the past decade. From 2014 to 2023, Intuit's EBITDA has surged by an impressive 200%, reflecting its robust growth and strategic market positioning. In contrast, Teradyne's EBITDA, while showing a healthy increase, has experienced more fluctuations, peaking in 2021 with a 230% rise from its 2014 figures.
Intuit's consistent upward trajectory highlights its resilience and adaptability in a competitive market, whereas Teradyne's performance underscores the challenges and opportunities within the semiconductor industry. Notably, the data for 2024 is incomplete, leaving room for speculation on Teradyne's future performance. This analysis not only showcases the financial health of these giants but also offers insights into the broader economic trends shaping their industries.
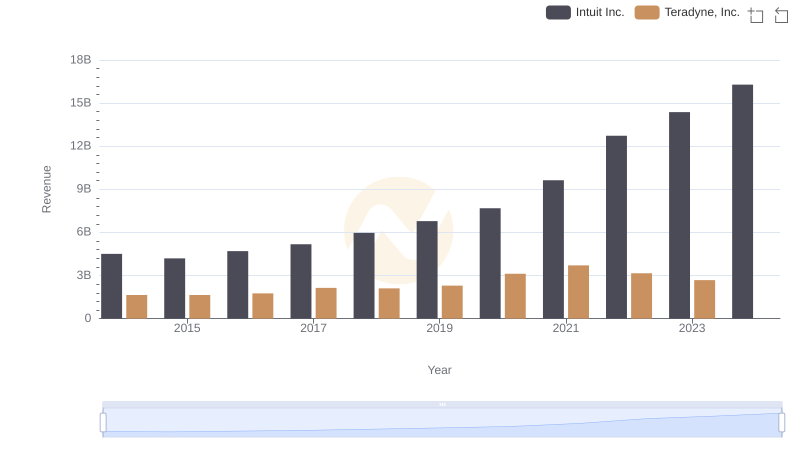
Annual Revenue Comparison: Intuit Inc. vs Teradyne, Inc.

Cost of Revenue Comparison: Intuit Inc. vs Teradyne, Inc.
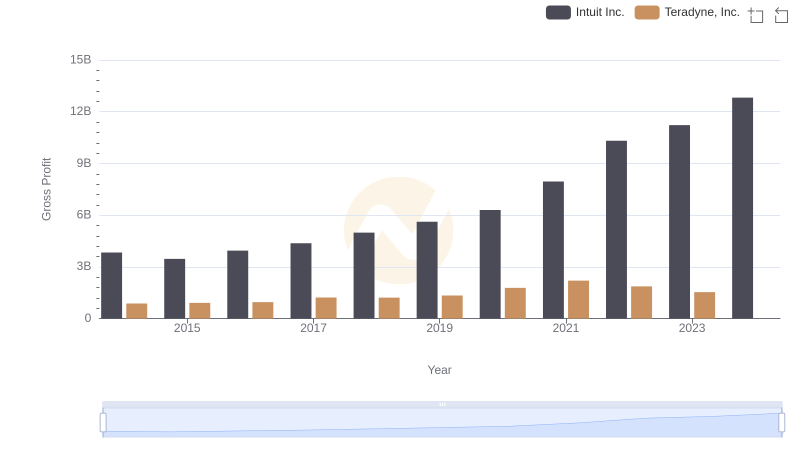
Gross Profit Analysis: Comparing Intuit Inc. and Teradyne, Inc.
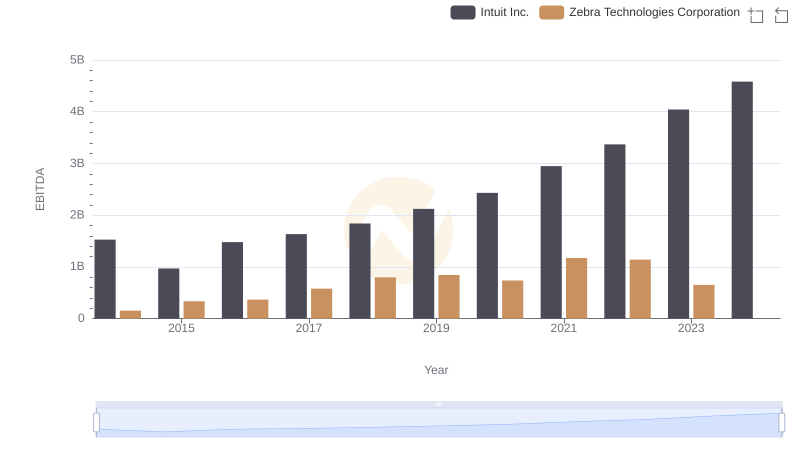
EBITDA Analysis: Evaluating Intuit Inc. Against Zebra Technologies Corporation

Research and Development Expenses Breakdown: Intuit Inc. vs Teradyne, Inc.
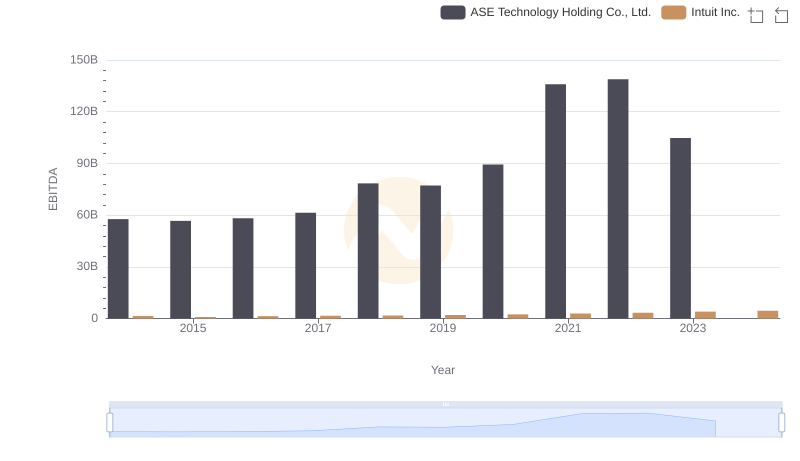
EBITDA Metrics Evaluated: Intuit Inc. vs ASE Technology Holding Co., Ltd.

Intuit Inc. and Teradyne, Inc.: SG&A Spending Patterns Compared
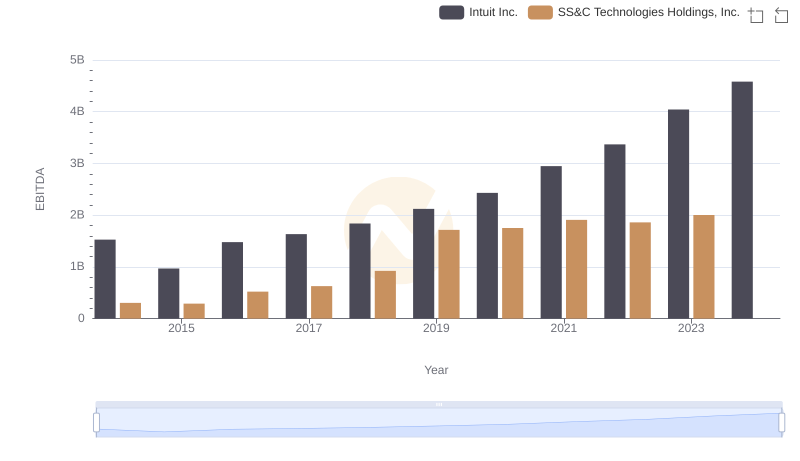
EBITDA Performance Review: Intuit Inc. vs SS&C Technologies Holdings, Inc.
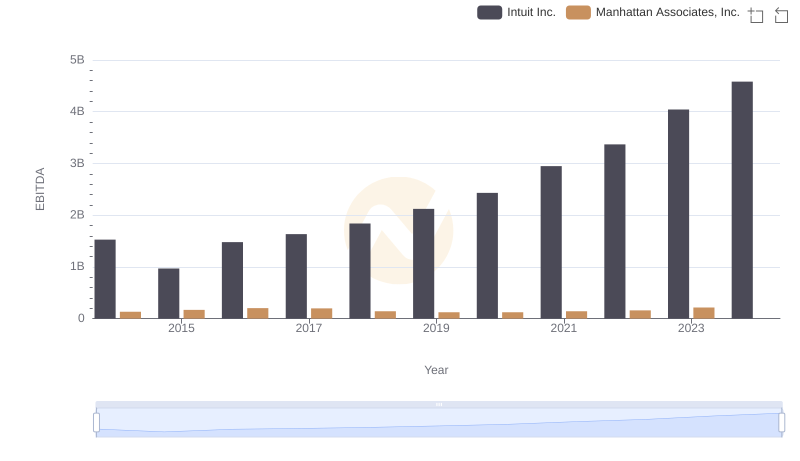
Comprehensive EBITDA Comparison: Intuit Inc. vs Manhattan Associates, Inc.
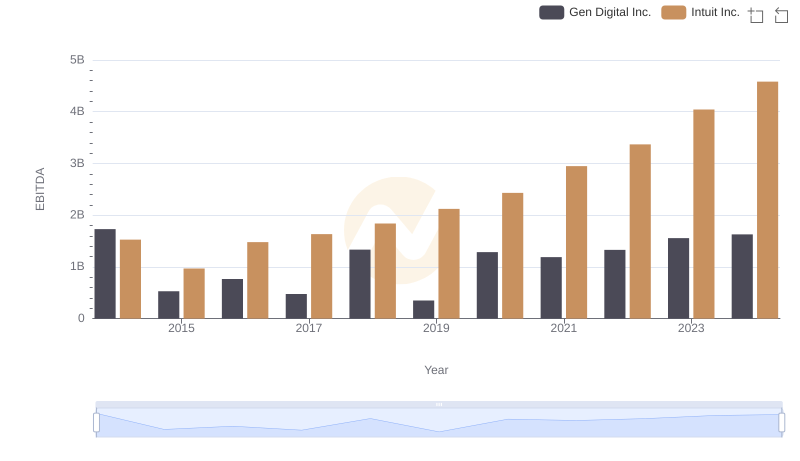
EBITDA Metrics Evaluated: Intuit Inc. vs Gen Digital Inc.
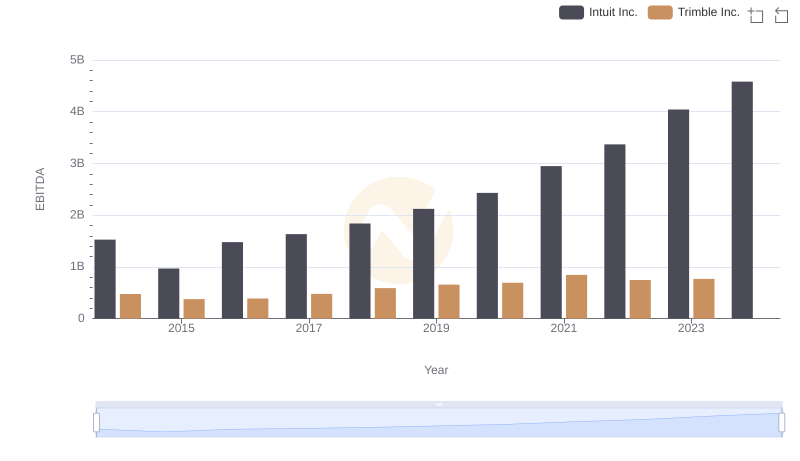
Comparative EBITDA Analysis: Intuit Inc. vs Trimble Inc.
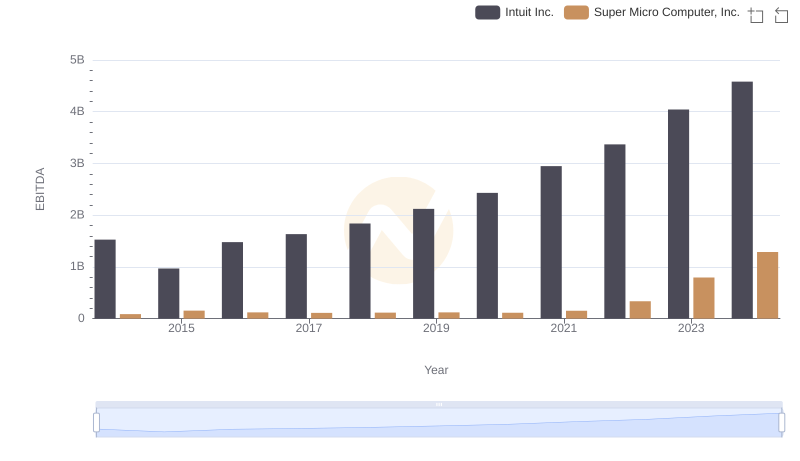
A Side-by-Side Analysis of EBITDA: Intuit Inc. and Super Micro Computer, Inc.