| __timestamp | Intuit Inc. | Teradyne, Inc. |
|---|---|---|
| Wednesday, January 1, 2014 | 4506000000 | 1647824000 |
| Thursday, January 1, 2015 | 4192000000 | 1639578000 |
| Friday, January 1, 2016 | 4694000000 | 1753250000 |
| Sunday, January 1, 2017 | 5177000000 | 2136606000 |
| Monday, January 1, 2018 | 5964000000 | 2100802000 |
| Tuesday, January 1, 2019 | 6784000000 | 2294965000 |
| Wednesday, January 1, 2020 | 7679000000 | 3121469000 |
| Friday, January 1, 2021 | 9633000000 | 3702881000 |
| Saturday, January 1, 2022 | 12726000000 | 3155045000 |
| Sunday, January 1, 2023 | 14368000000 | 2676298000 |
| Monday, January 1, 2024 | 16285000000 | 2819880000 |
In pursuit of knowledge
In the ever-evolving landscape of technology and finance, Intuit Inc. and Teradyne, Inc. have carved distinct paths over the past decade. From 2014 to 2023, Intuit's revenue surged by an impressive 261%, reflecting its robust growth in financial software solutions. In contrast, Teradyne, a leader in semiconductor testing, experienced a more modest 62% increase in revenue over the same period.
Intuit's revenue growth is a testament to its strategic innovations and market adaptability. By 2023, its revenue had reached nearly four times that of 2014, showcasing its dominance in the financial tech sector.
While Teradyne's growth was less dramatic, it remained consistent, peaking in 2021. However, the subsequent decline highlights challenges in the semiconductor industry.
This comparison underscores the dynamic nature of tech-driven industries, where adaptability and innovation are key to sustained success.
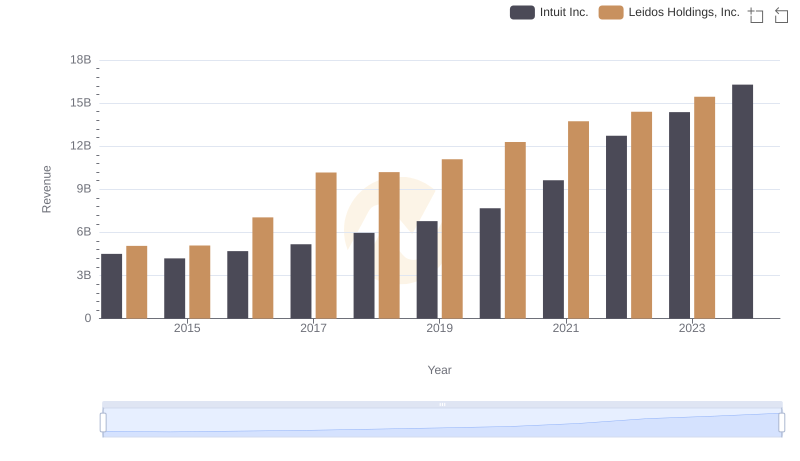
Intuit Inc. vs Leidos Holdings, Inc.: Examining Key Revenue Metrics
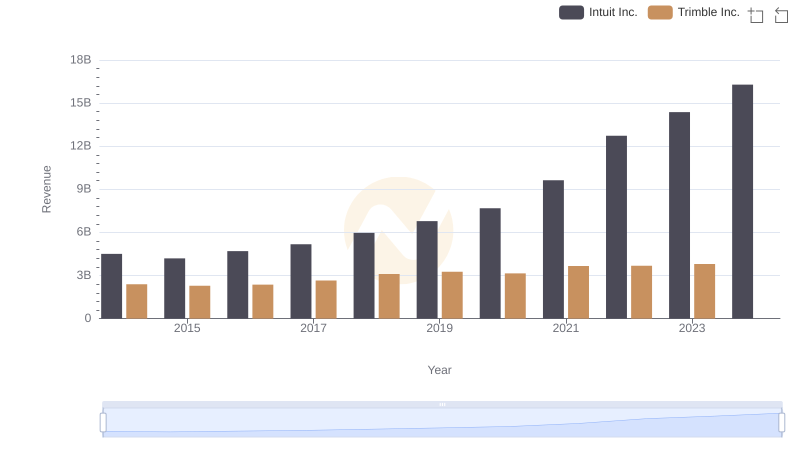
Breaking Down Revenue Trends: Intuit Inc. vs Trimble Inc.
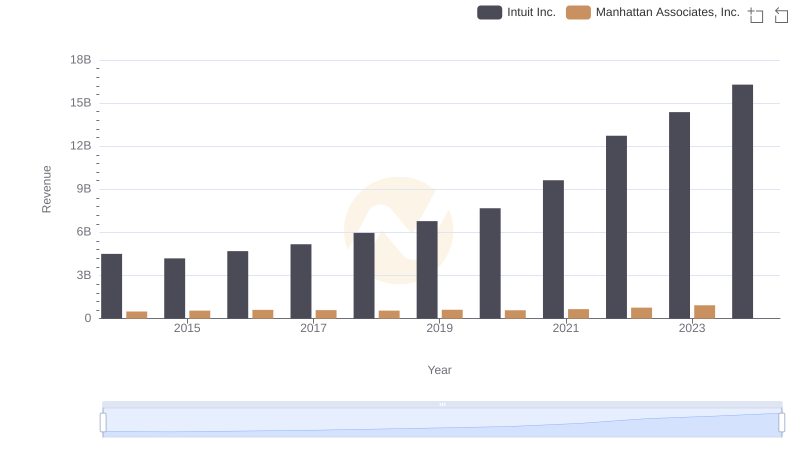
Annual Revenue Comparison: Intuit Inc. vs Manhattan Associates, Inc.
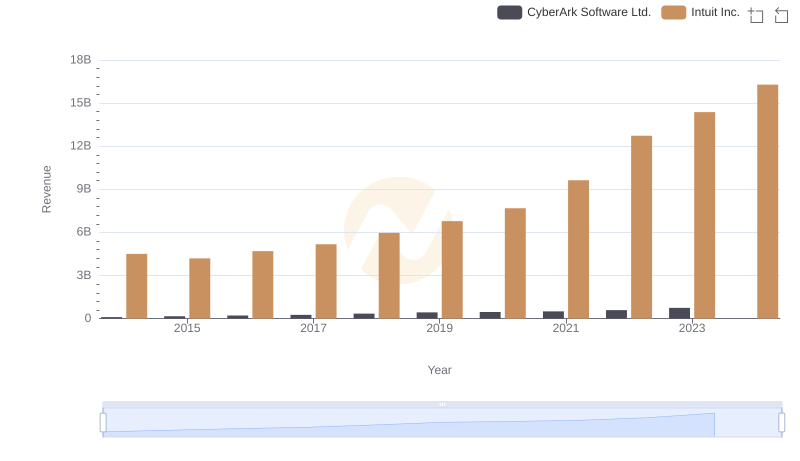
Who Generates More Revenue? Intuit Inc. or CyberArk Software Ltd.

Cost of Revenue Comparison: Intuit Inc. vs Teradyne, Inc.
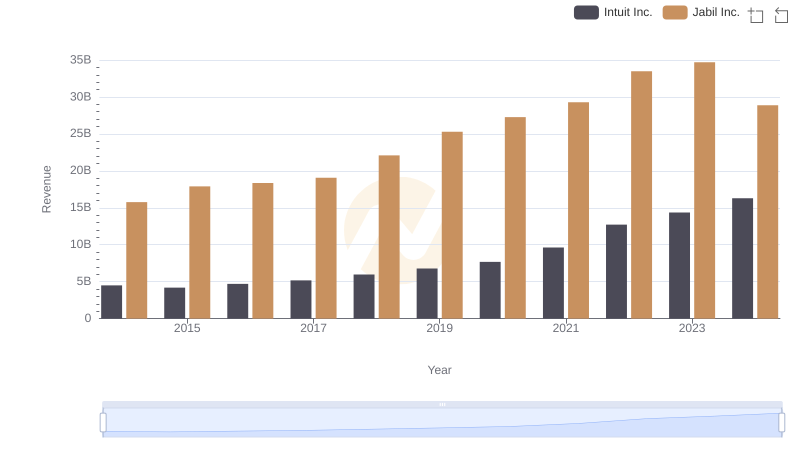
Intuit Inc. and Jabil Inc.: A Comprehensive Revenue Analysis
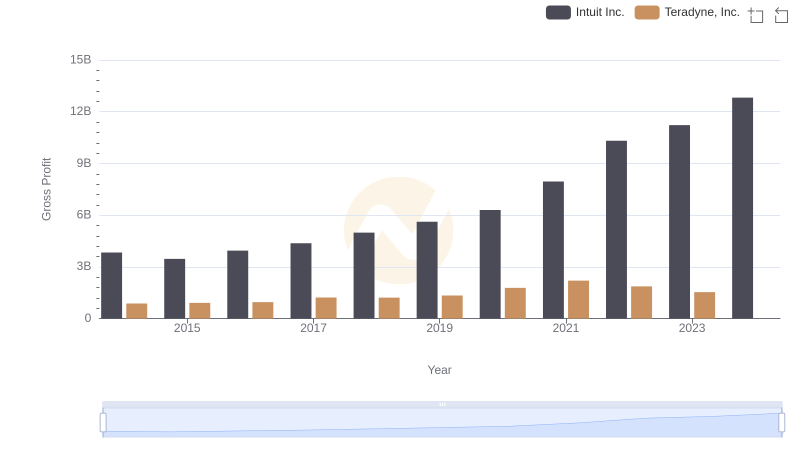
Gross Profit Analysis: Comparing Intuit Inc. and Teradyne, Inc.
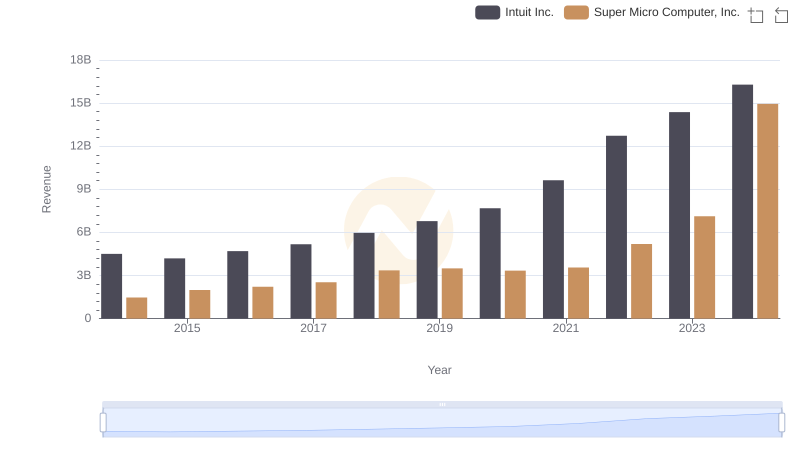
Breaking Down Revenue Trends: Intuit Inc. vs Super Micro Computer, Inc.
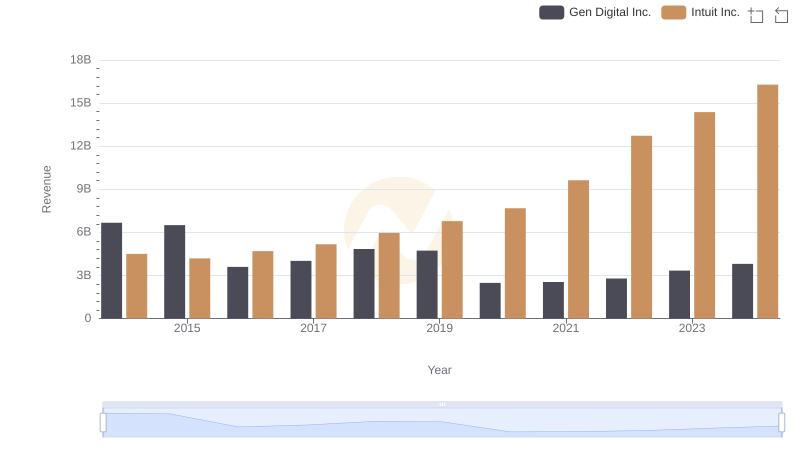
Intuit Inc. or Gen Digital Inc.: Who Leads in Yearly Revenue?

Research and Development Expenses Breakdown: Intuit Inc. vs Teradyne, Inc.

Intuit Inc. and Teradyne, Inc.: SG&A Spending Patterns Compared
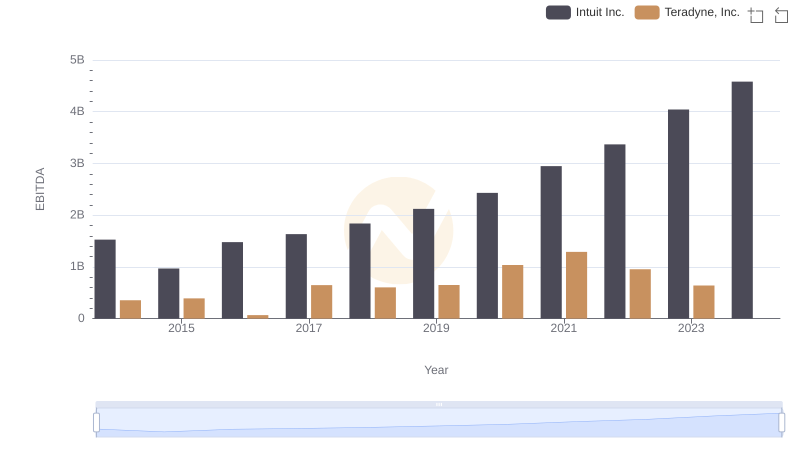
A Side-by-Side Analysis of EBITDA: Intuit Inc. and Teradyne, Inc.