| __timestamp | Intuit Inc. | Teradyne, Inc. |
|---|---|---|
| Wednesday, January 1, 2014 | 668000000 | 769016000 |
| Thursday, January 1, 2015 | 725000000 | 723935000 |
| Friday, January 1, 2016 | 752000000 | 793683000 |
| Sunday, January 1, 2017 | 809000000 | 912734000 |
| Monday, January 1, 2018 | 977000000 | 880408000 |
| Tuesday, January 1, 2019 | 1167000000 | 955136000 |
| Wednesday, January 1, 2020 | 1378000000 | 1335728000 |
| Friday, January 1, 2021 | 1683000000 | 1496225000 |
| Saturday, January 1, 2022 | 2406000000 | 1287894000 |
| Sunday, January 1, 2023 | 3143000000 | 1139550000 |
| Monday, January 1, 2024 | 3465000000 | 1170953000 |
Igniting the spark of knowledge
In the ever-evolving landscape of technology, Intuit Inc. and Teradyne, Inc. have showcased intriguing trends in their cost of revenue over the past decade. From 2014 to 2023, Intuit's cost of revenue surged by over 400%, reflecting its aggressive growth strategy and expanding market presence. In contrast, Teradyne's cost of revenue exhibited a more modest increase of approximately 48% during the same period, highlighting its steady yet cautious approach.
By 2023, Intuit's cost of revenue had reached nearly three times that of Teradyne, underscoring its significant investment in scaling operations. Notably, 2024 data for Teradyne is missing, leaving room for speculation on its future trajectory. This comparison not only illustrates the distinct paths these companies have taken but also offers insights into their strategic priorities in a competitive industry.
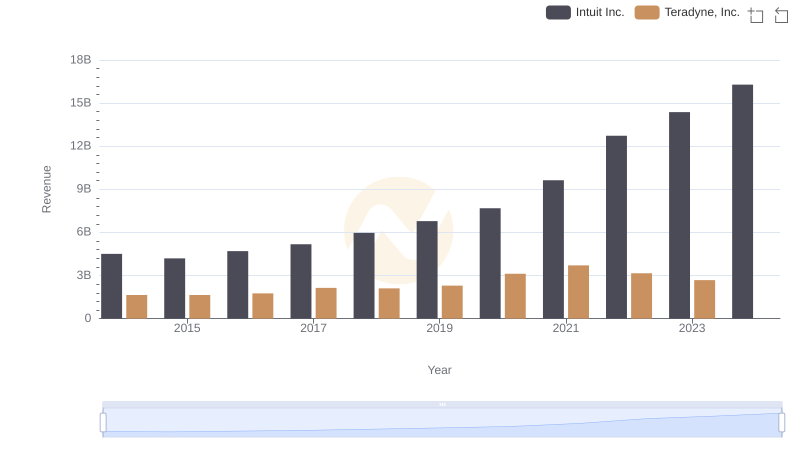
Annual Revenue Comparison: Intuit Inc. vs Teradyne, Inc.
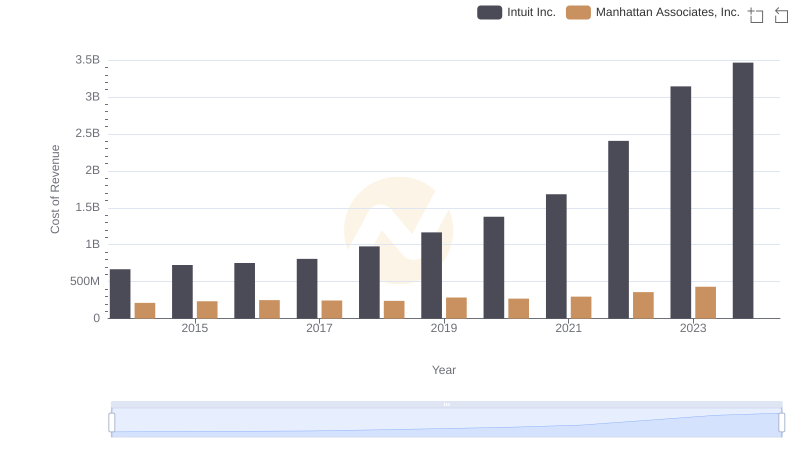
Analyzing Cost of Revenue: Intuit Inc. and Manhattan Associates, Inc.
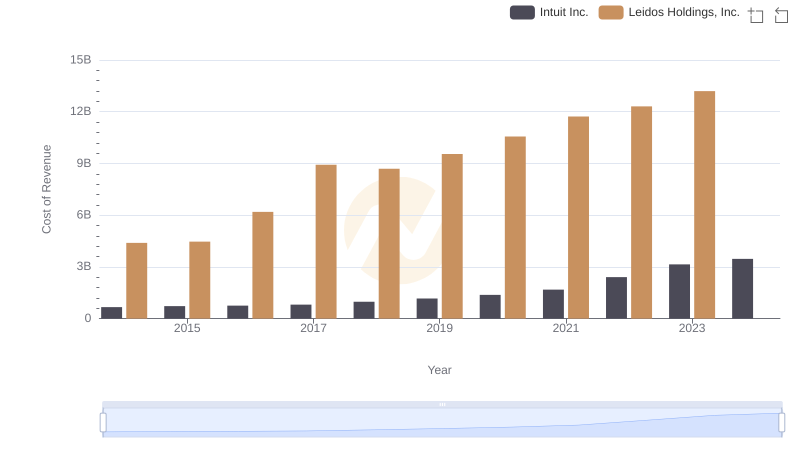
Intuit Inc. vs Leidos Holdings, Inc.: Efficiency in Cost of Revenue Explored
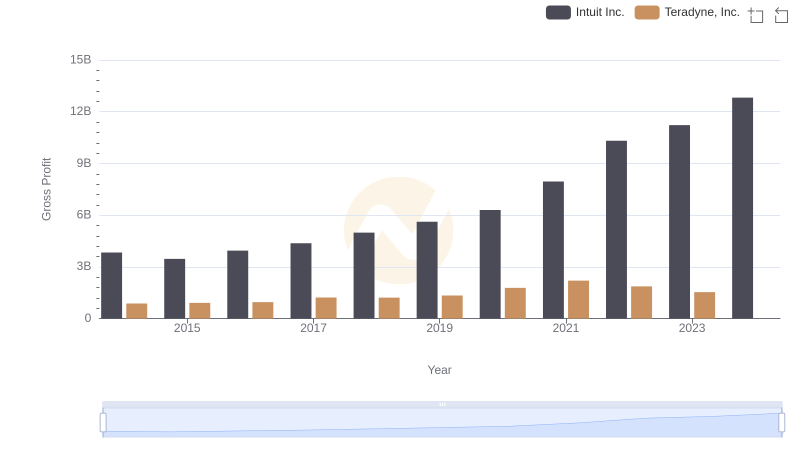
Gross Profit Analysis: Comparing Intuit Inc. and Teradyne, Inc.
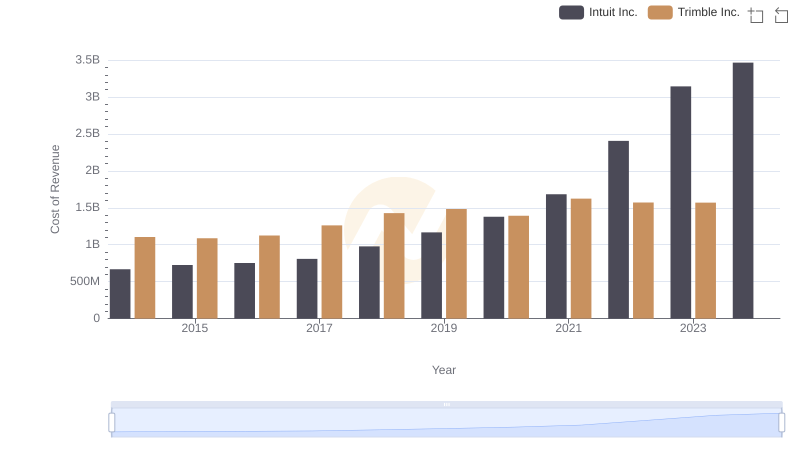
Comparing Cost of Revenue Efficiency: Intuit Inc. vs Trimble Inc.
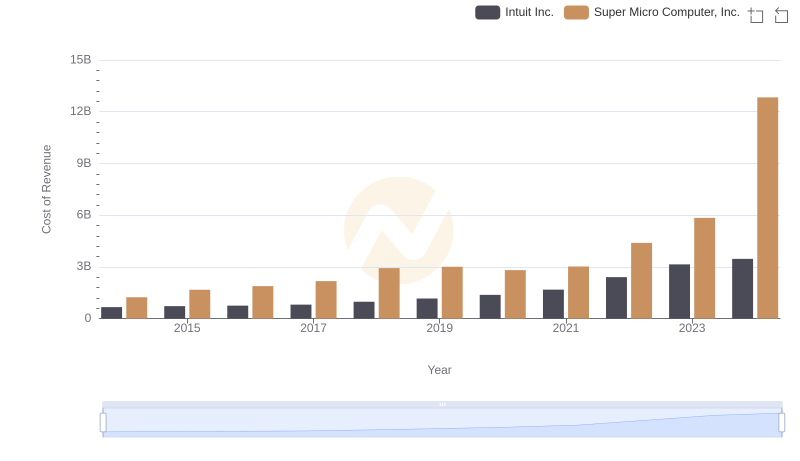
Cost of Revenue: Key Insights for Intuit Inc. and Super Micro Computer, Inc.
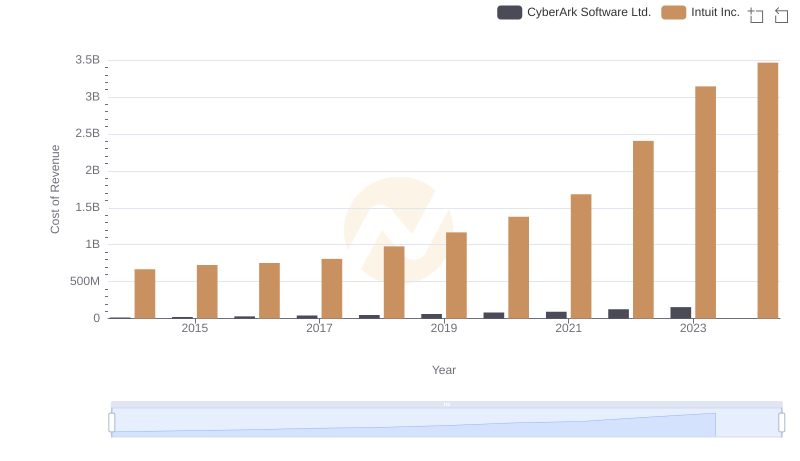
Cost of Revenue Trends: Intuit Inc. vs CyberArk Software Ltd.
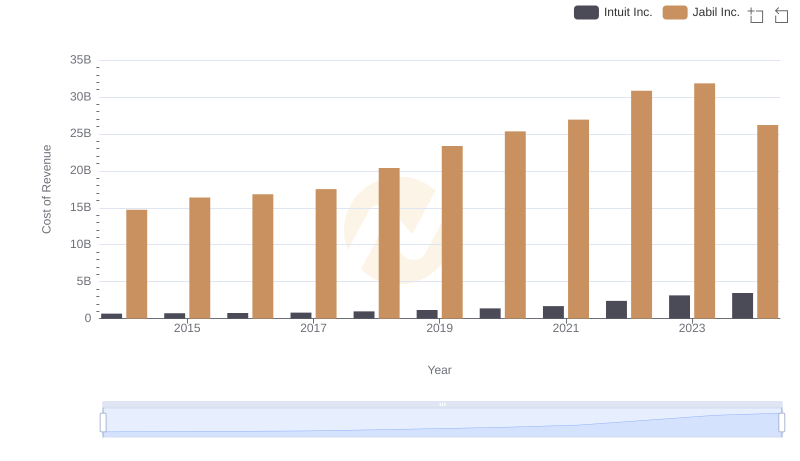
Cost Insights: Breaking Down Intuit Inc. and Jabil Inc.'s Expenses
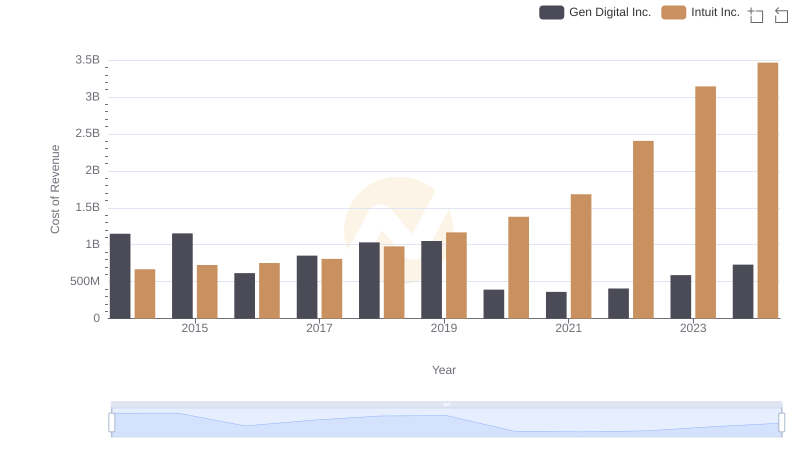
Comparing Cost of Revenue Efficiency: Intuit Inc. vs Gen Digital Inc.

Research and Development Expenses Breakdown: Intuit Inc. vs Teradyne, Inc.

Intuit Inc. and Teradyne, Inc.: SG&A Spending Patterns Compared
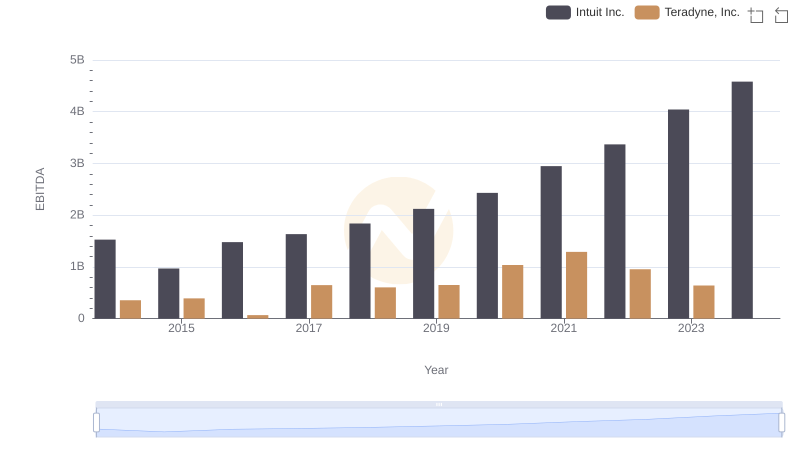
A Side-by-Side Analysis of EBITDA: Intuit Inc. and Teradyne, Inc.