| __timestamp | Intuit Inc. | Marvell Technology, Inc. |
|---|---|---|
| Wednesday, January 1, 2014 | 3838000000 | 1750170000 |
| Thursday, January 1, 2015 | 3467000000 | 1863257000 |
| Friday, January 1, 2016 | 3942000000 | 1231092000 |
| Sunday, January 1, 2017 | 4368000000 | 1288147000 |
| Monday, January 1, 2018 | 4987000000 | 1461940000 |
| Tuesday, January 1, 2019 | 5617000000 | 1458392000 |
| Wednesday, January 1, 2020 | 6301000000 | 1356941000 |
| Friday, January 1, 2021 | 7950000000 | 1488350000 |
| Saturday, January 1, 2022 | 10320000000 | 2064225000 |
| Sunday, January 1, 2023 | 11225000000 | 2987500000 |
| Monday, January 1, 2024 | 12820000000 | 2293600000 |
Unveiling the hidden dimensions of data
In the ever-evolving landscape of technology, financial performance is a key indicator of a company's resilience and growth. Over the past decade, Intuit Inc. and Marvell Technology, Inc. have showcased contrasting trajectories in their gross profit margins.
From 2014 to 2024, Intuit Inc. has demonstrated a remarkable upward trend, with its gross profit increasing by over 230%. This consistent growth reflects Intuit's strategic innovations and market adaptability, positioning it as a leader in financial software solutions.
Conversely, Marvell Technology, Inc. has experienced a more modest increase of approximately 31% in the same period. Despite facing industry challenges, Marvell's focus on semiconductor solutions has enabled it to maintain a steady growth trajectory.
This comparative analysis highlights the diverse strategies and market dynamics influencing these tech giants' financial outcomes.
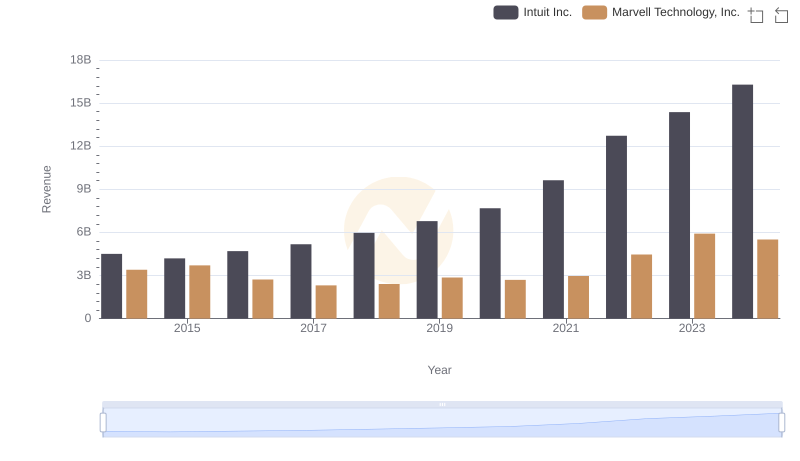
Intuit Inc. vs Marvell Technology, Inc.: Annual Revenue Growth Compared
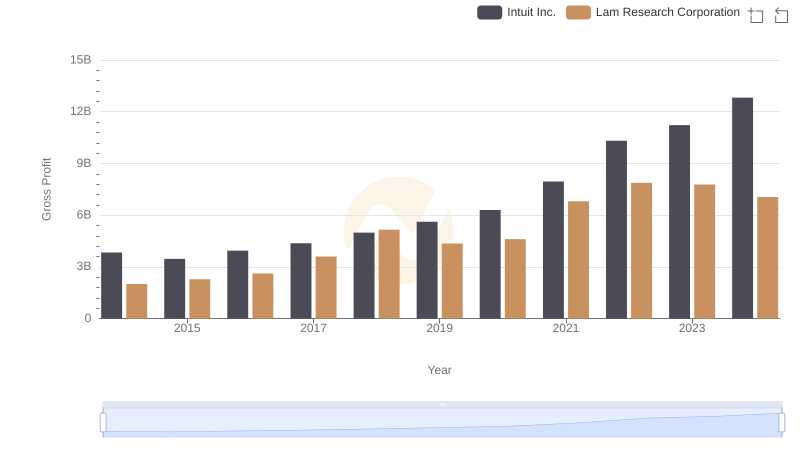
Gross Profit Comparison: Intuit Inc. and Lam Research Corporation Trends
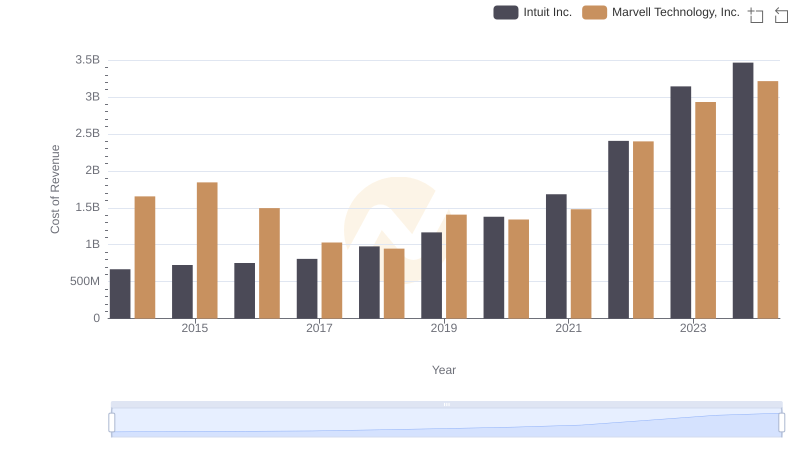
Cost of Revenue Comparison: Intuit Inc. vs Marvell Technology, Inc.
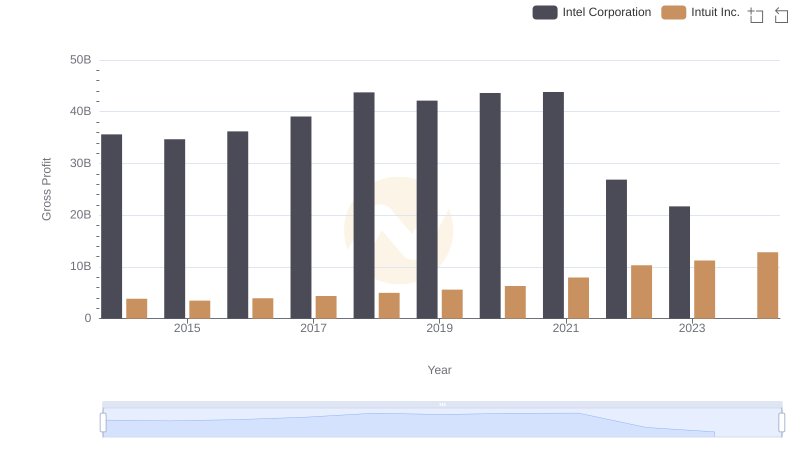
Intuit Inc. vs Intel Corporation: A Gross Profit Performance Breakdown
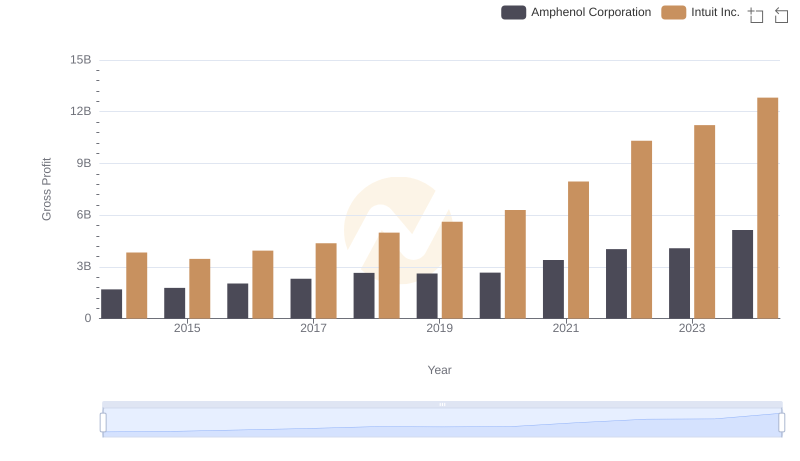
Gross Profit Analysis: Comparing Intuit Inc. and Amphenol Corporation
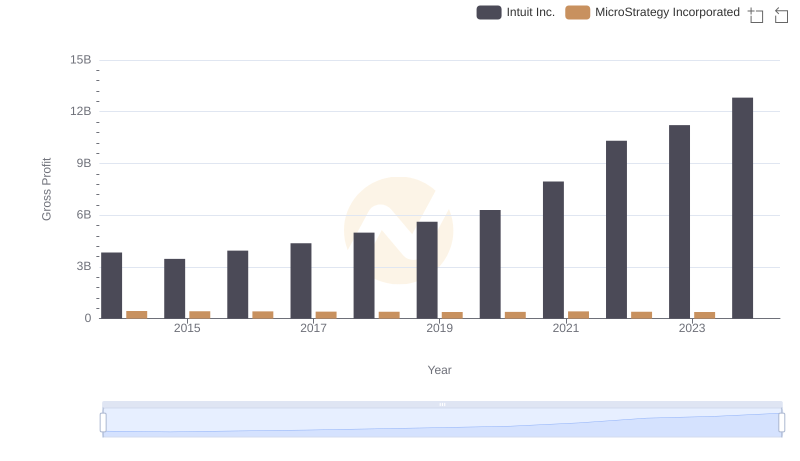
Gross Profit Comparison: Intuit Inc. and MicroStrategy Incorporated Trends
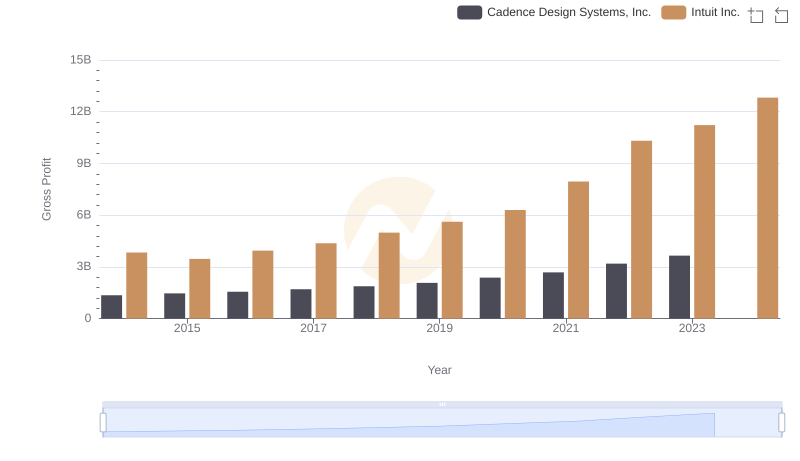
Key Insights on Gross Profit: Intuit Inc. vs Cadence Design Systems, Inc.
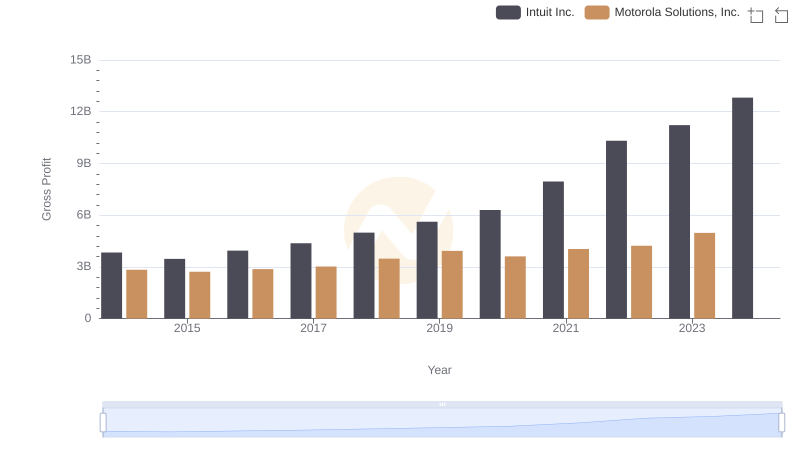
Intuit Inc. and Motorola Solutions, Inc.: A Detailed Gross Profit Analysis
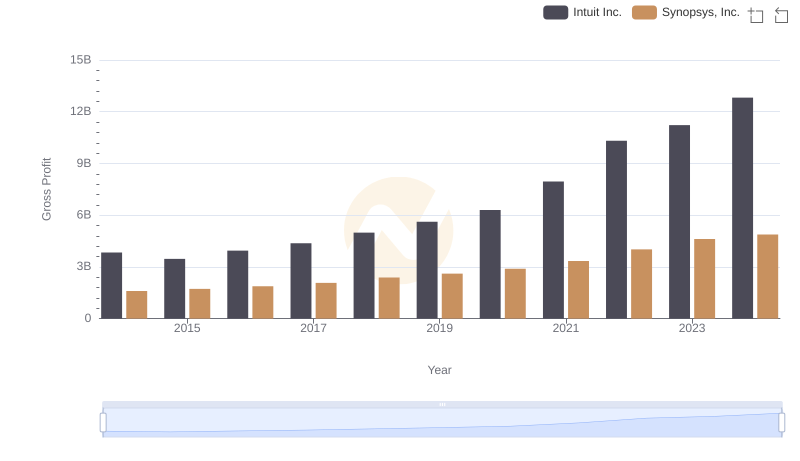
Intuit Inc. and Synopsys, Inc.: A Detailed Gross Profit Analysis
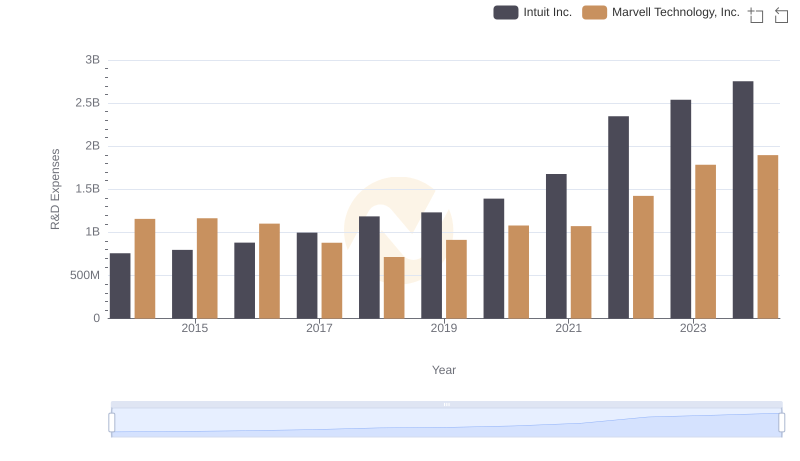
Research and Development Expenses Breakdown: Intuit Inc. vs Marvell Technology, Inc.
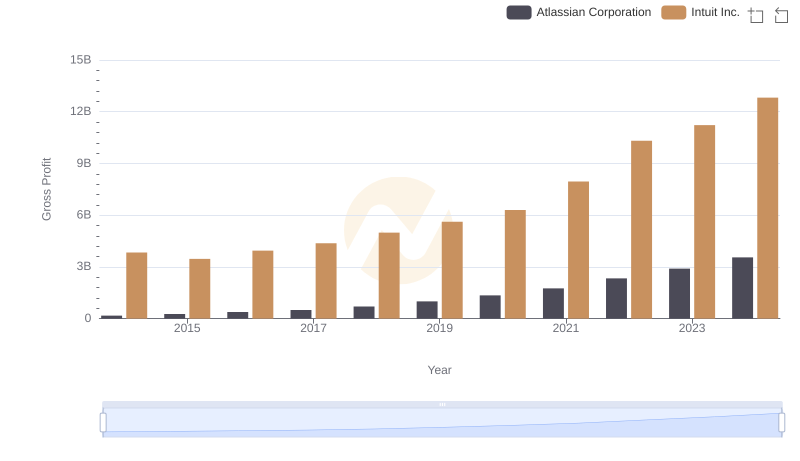
Gross Profit Analysis: Comparing Intuit Inc. and Atlassian Corporation
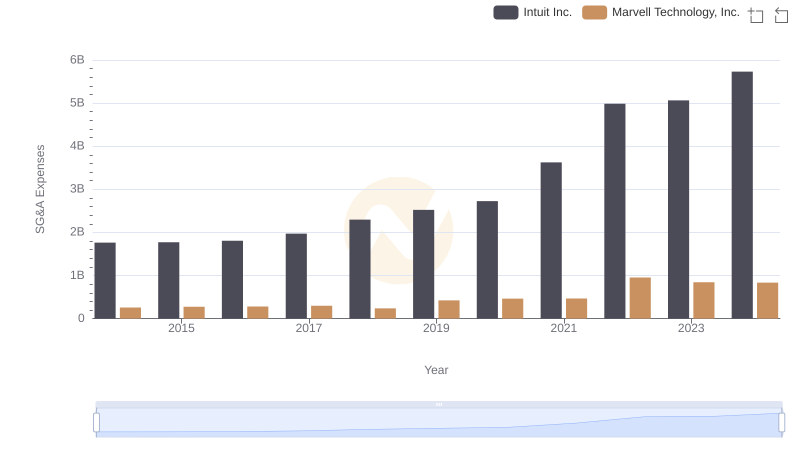
Operational Costs Compared: SG&A Analysis of Intuit Inc. and Marvell Technology, Inc.