| __timestamp | Intuit Inc. | Marvell Technology, Inc. |
|---|---|---|
| Wednesday, January 1, 2014 | 668000000 | 1654230000 |
| Thursday, January 1, 2015 | 725000000 | 1843706000 |
| Friday, January 1, 2016 | 752000000 | 1494736000 |
| Sunday, January 1, 2017 | 809000000 | 1029527000 |
| Monday, January 1, 2018 | 977000000 | 947230000 |
| Tuesday, January 1, 2019 | 1167000000 | 1407399000 |
| Wednesday, January 1, 2020 | 1378000000 | 1342220000 |
| Friday, January 1, 2021 | 1683000000 | 1480550000 |
| Saturday, January 1, 2022 | 2406000000 | 2398158000 |
| Sunday, January 1, 2023 | 3143000000 | 2932100000 |
| Monday, January 1, 2024 | 3465000000 | 3214100000 |
Cracking the code
In the ever-evolving landscape of technology, understanding the cost of revenue is crucial for assessing a company's financial health. This chart provides a fascinating comparison between Intuit Inc. and Marvell Technology, Inc., two titans in the tech industry, from 2014 to 2024.
Intuit Inc., known for its financial software, has seen a remarkable increase in its cost of revenue over the years. From 2014 to 2024, Intuit's cost of revenue surged by over 400%, reflecting its aggressive expansion and investment in new technologies.
Marvell Technology, Inc., a leader in semiconductor solutions, also experienced a significant rise, with its cost of revenue increasing by nearly 95% during the same period. This growth underscores Marvell's strategic focus on innovation and market expansion.
Both companies demonstrate the dynamic nature of the tech industry, where strategic investments drive substantial growth.
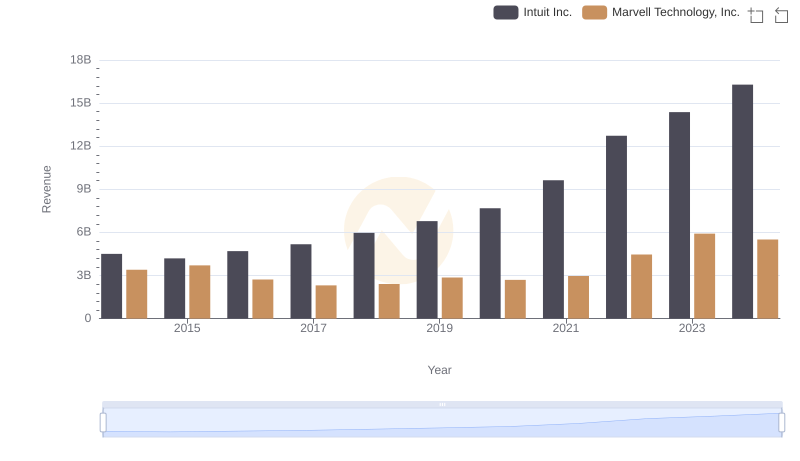
Intuit Inc. vs Marvell Technology, Inc.: Annual Revenue Growth Compared
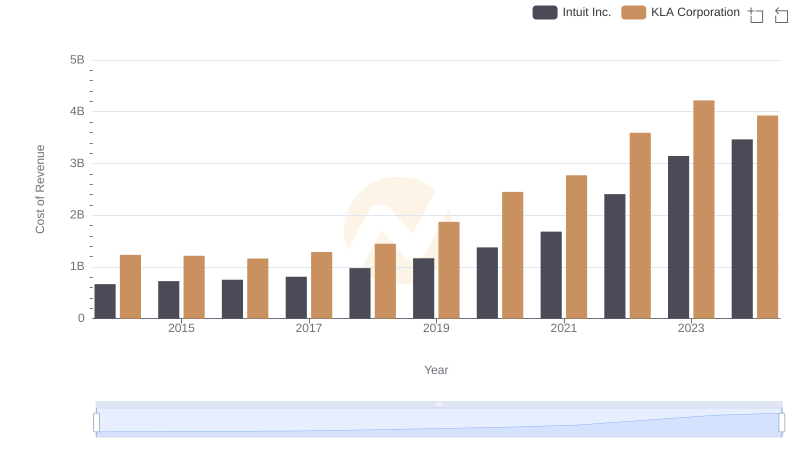
Cost of Revenue Trends: Intuit Inc. vs KLA Corporation
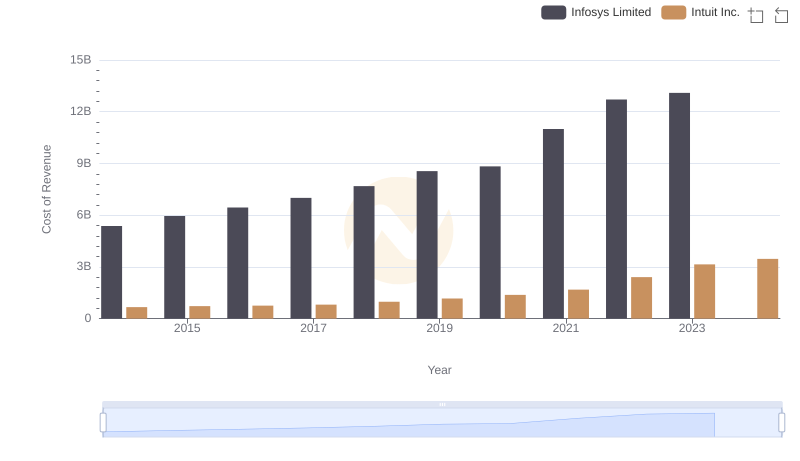
Comparing Cost of Revenue Efficiency: Intuit Inc. vs Infosys Limited
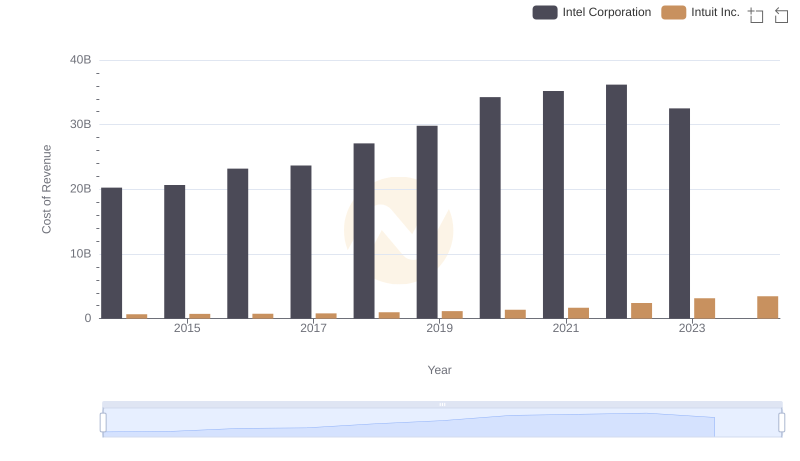
Intuit Inc. vs Intel Corporation: Efficiency in Cost of Revenue Explored
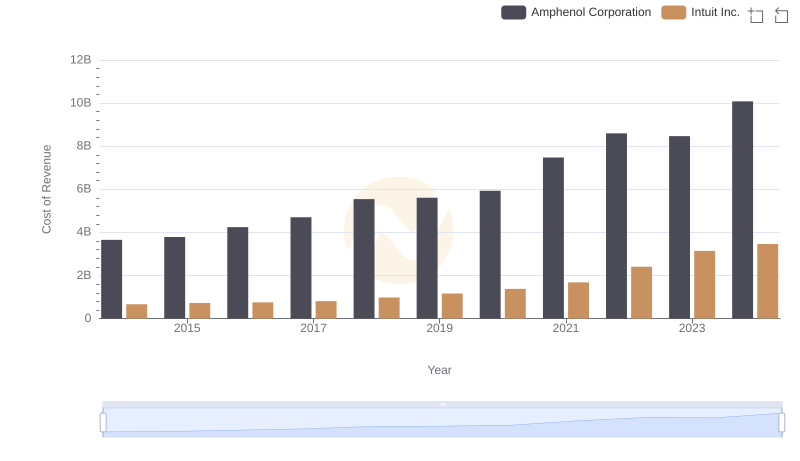
Analyzing Cost of Revenue: Intuit Inc. and Amphenol Corporation
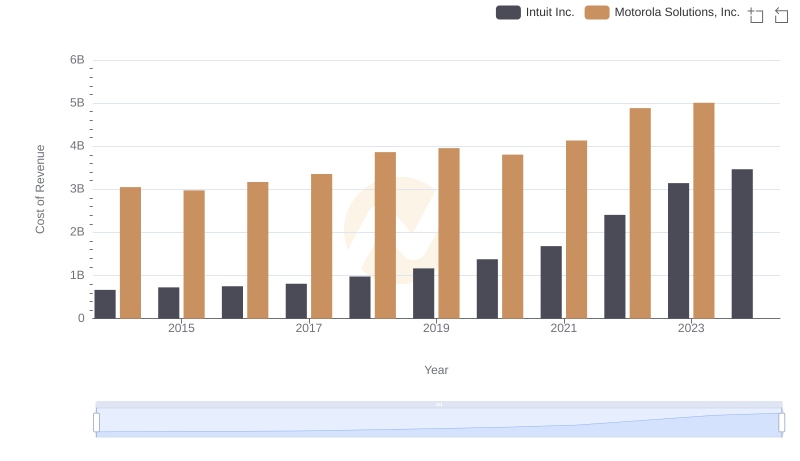
Cost Insights: Breaking Down Intuit Inc. and Motorola Solutions, Inc.'s Expenses
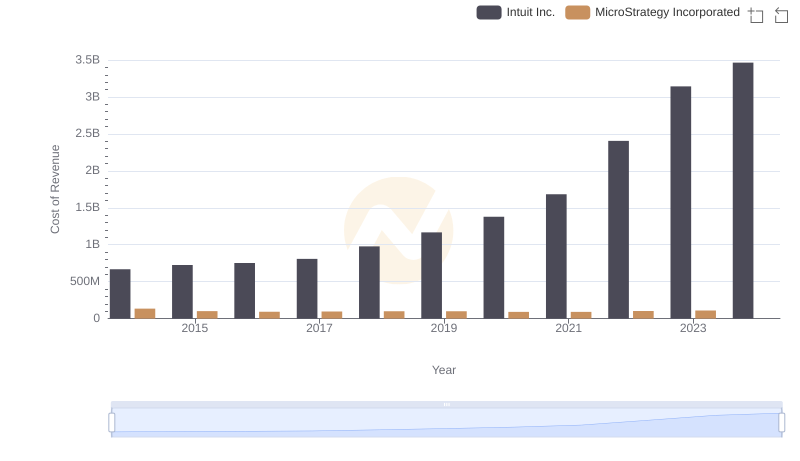
Analyzing Cost of Revenue: Intuit Inc. and MicroStrategy Incorporated
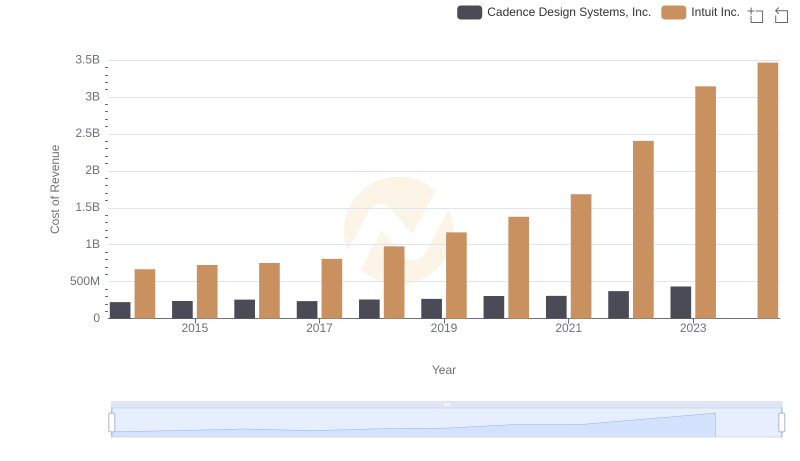
Cost of Revenue Trends: Intuit Inc. vs Cadence Design Systems, Inc.
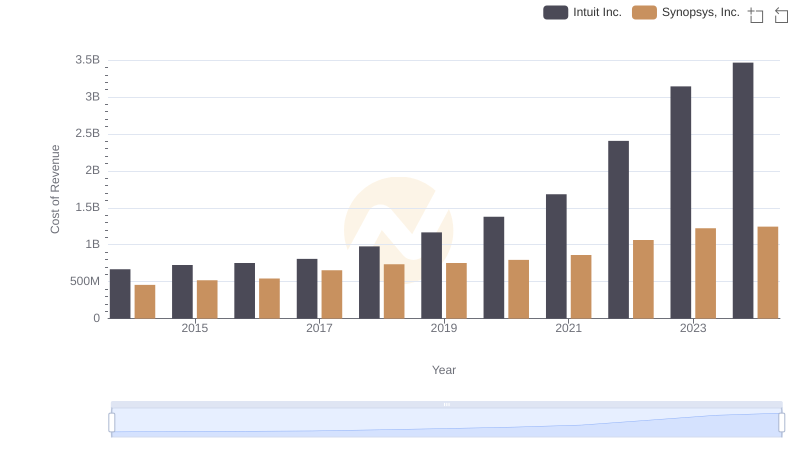
Comparing Cost of Revenue Efficiency: Intuit Inc. vs Synopsys, Inc.
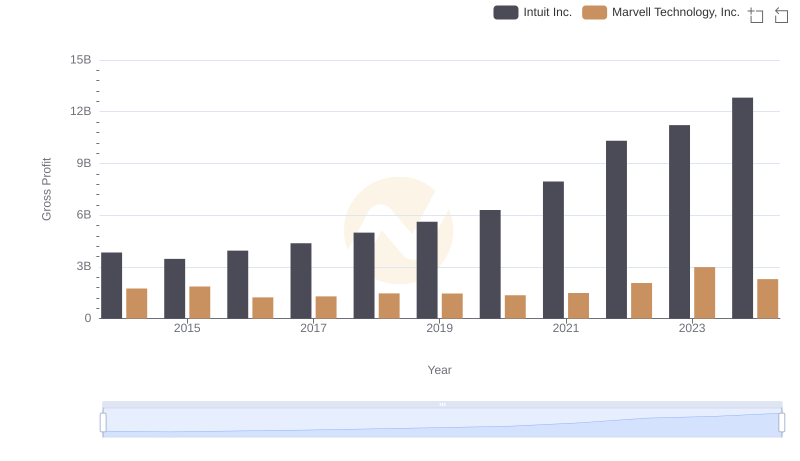
Gross Profit Analysis: Comparing Intuit Inc. and Marvell Technology, Inc.
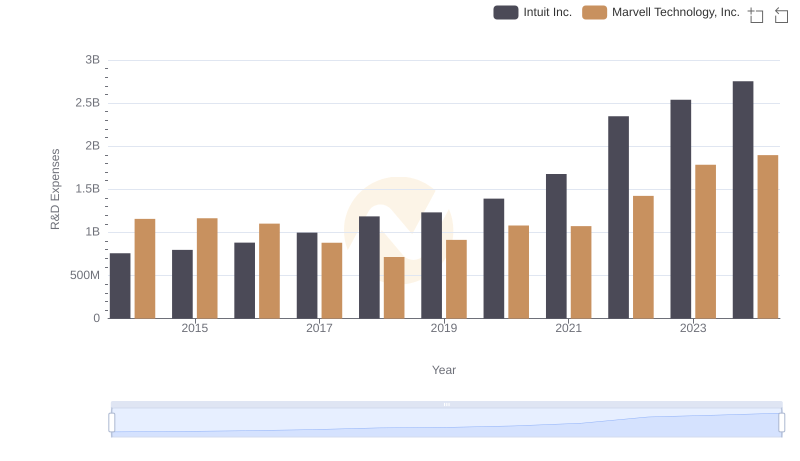
Research and Development Expenses Breakdown: Intuit Inc. vs Marvell Technology, Inc.
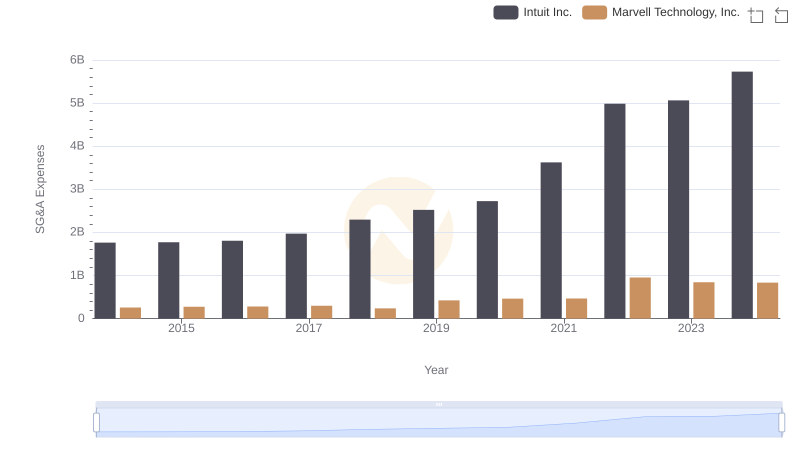
Operational Costs Compared: SG&A Analysis of Intuit Inc. and Marvell Technology, Inc.