| __timestamp | Intuit Inc. | Motorola Solutions, Inc. |
|---|---|---|
| Wednesday, January 1, 2014 | 3838000000 | 2831000000 |
| Thursday, January 1, 2015 | 3467000000 | 2719000000 |
| Friday, January 1, 2016 | 3942000000 | 2869000000 |
| Sunday, January 1, 2017 | 4368000000 | 3024000000 |
| Monday, January 1, 2018 | 4987000000 | 3480000000 |
| Tuesday, January 1, 2019 | 5617000000 | 3931000000 |
| Wednesday, January 1, 2020 | 6301000000 | 3608000000 |
| Friday, January 1, 2021 | 7950000000 | 4040000000 |
| Saturday, January 1, 2022 | 10320000000 | 4229000000 |
| Sunday, January 1, 2023 | 11225000000 | 4970000000 |
| Monday, January 1, 2024 | 12820000000 | 5512000000 |
Unveiling the hidden dimensions of data
In the ever-evolving landscape of technology and telecommunications, Intuit Inc. and Motorola Solutions, Inc. have carved out significant niches. From 2014 to 2023, Intuit's gross profit surged by an impressive 234%, reflecting its robust growth in financial software solutions. In contrast, Motorola Solutions, a stalwart in communication technology, saw a steady 76% increase in gross profit over the same period.
Intuit's remarkable growth trajectory, peaking at $12.82 billion in 2024, underscores its dominance in the financial tech sector. Meanwhile, Motorola Solutions reached a high of $4.97 billion in 2023, showcasing its resilience and adaptability. Notably, data for Motorola Solutions in 2024 is missing, leaving room for speculation on its future performance.
This analysis highlights the contrasting growth patterns of these industry leaders, offering insights into their strategic directions and market positions.
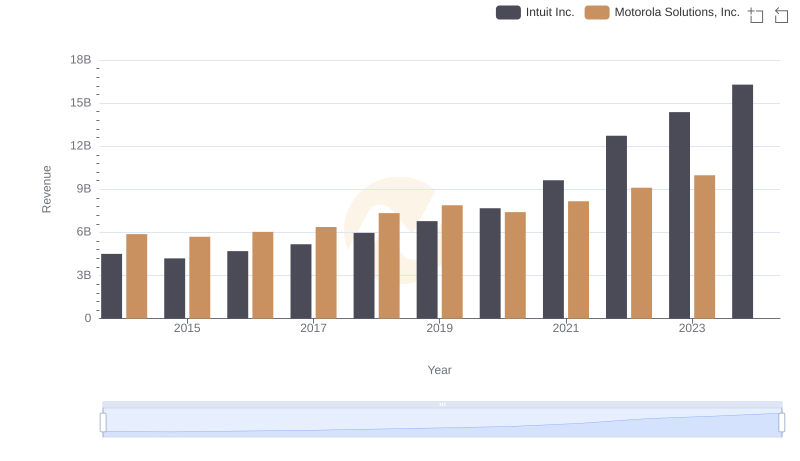
Breaking Down Revenue Trends: Intuit Inc. vs Motorola Solutions, Inc.
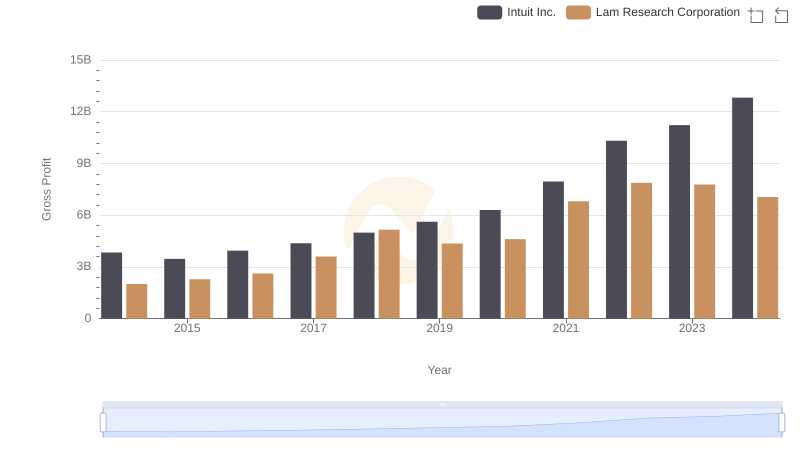
Gross Profit Comparison: Intuit Inc. and Lam Research Corporation Trends
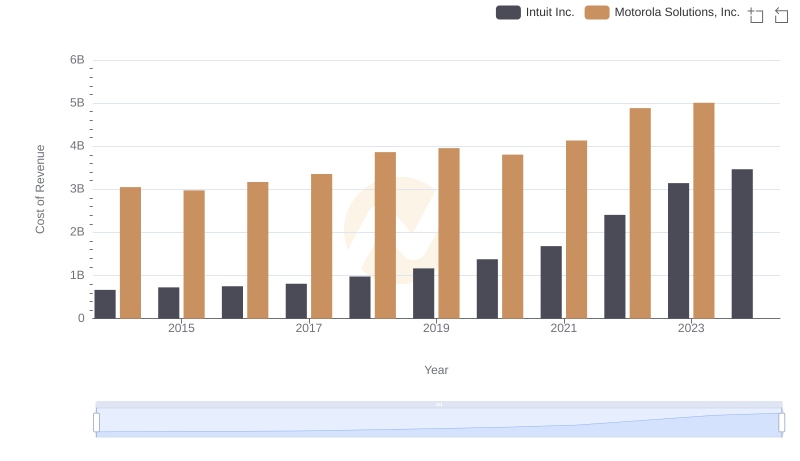
Cost Insights: Breaking Down Intuit Inc. and Motorola Solutions, Inc.'s Expenses
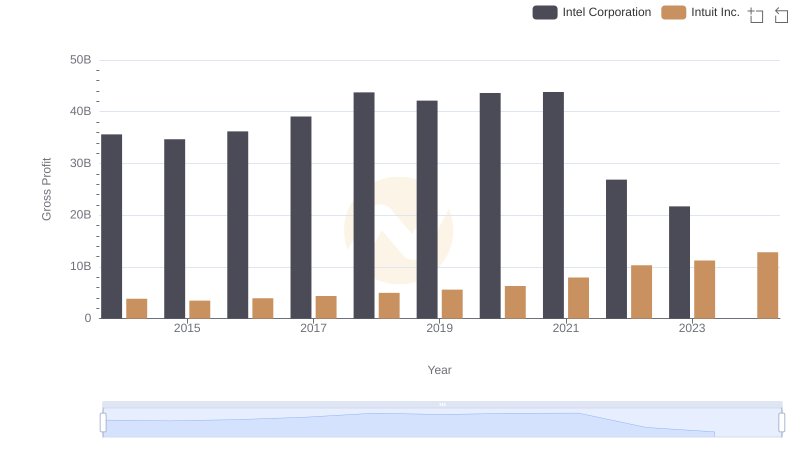
Intuit Inc. vs Intel Corporation: A Gross Profit Performance Breakdown
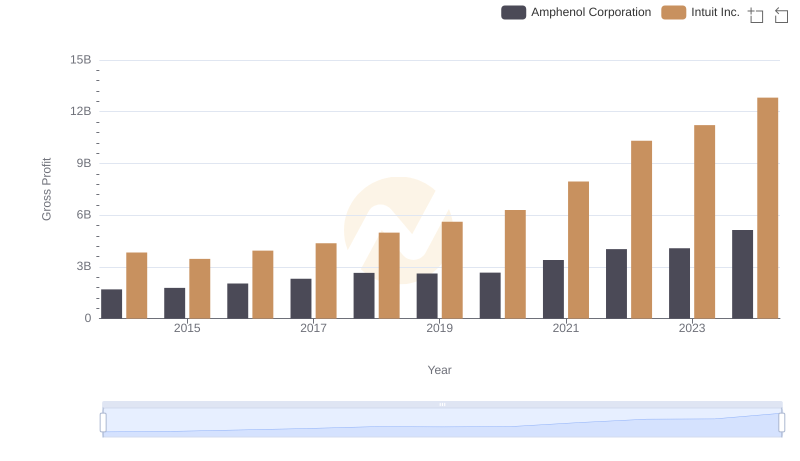
Gross Profit Analysis: Comparing Intuit Inc. and Amphenol Corporation
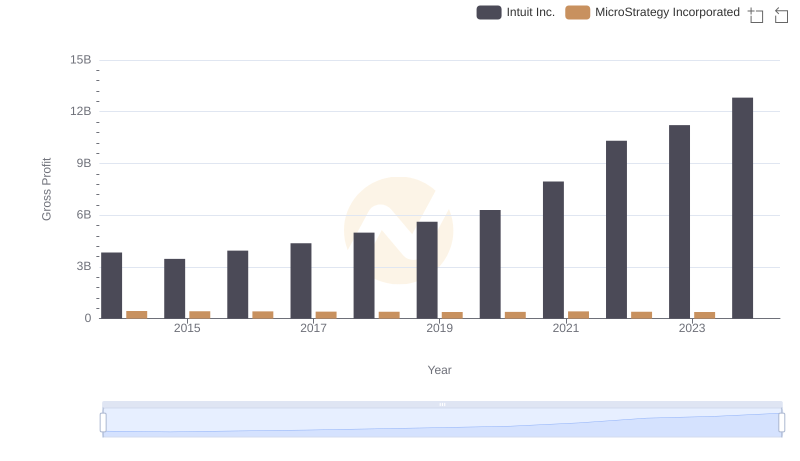
Gross Profit Comparison: Intuit Inc. and MicroStrategy Incorporated Trends
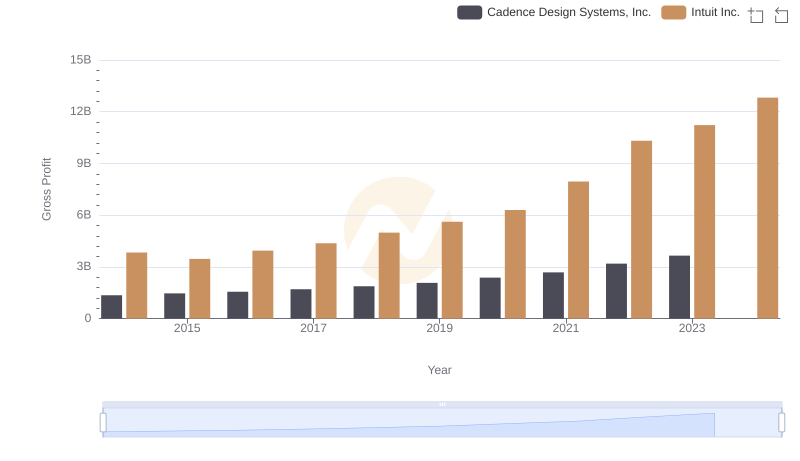
Key Insights on Gross Profit: Intuit Inc. vs Cadence Design Systems, Inc.
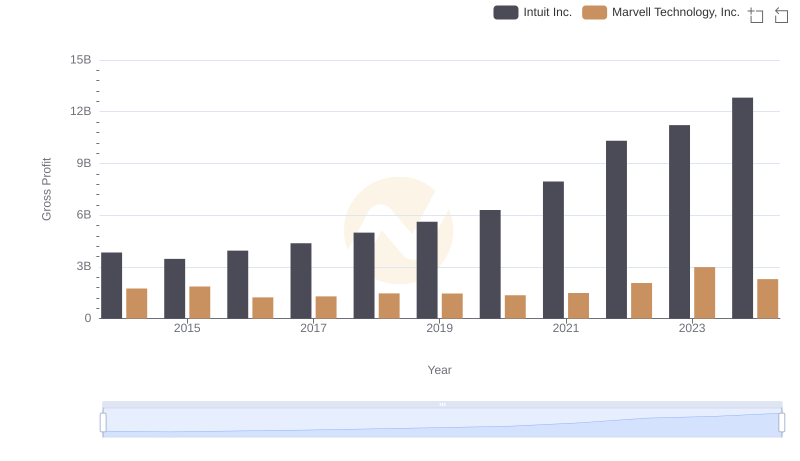
Gross Profit Analysis: Comparing Intuit Inc. and Marvell Technology, Inc.
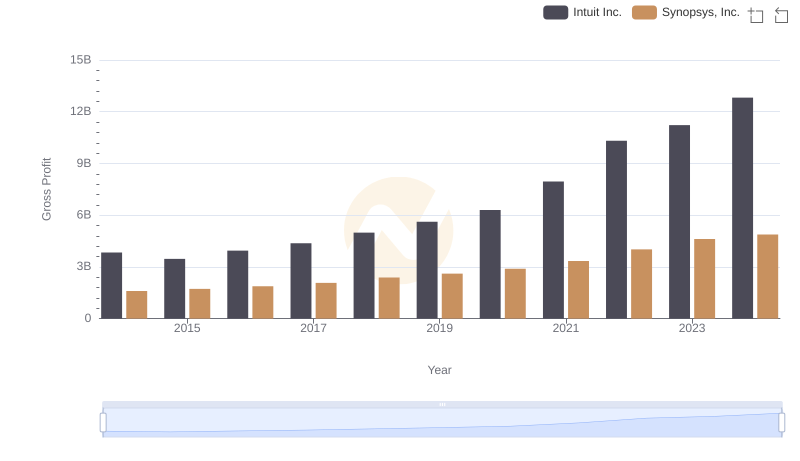
Intuit Inc. and Synopsys, Inc.: A Detailed Gross Profit Analysis
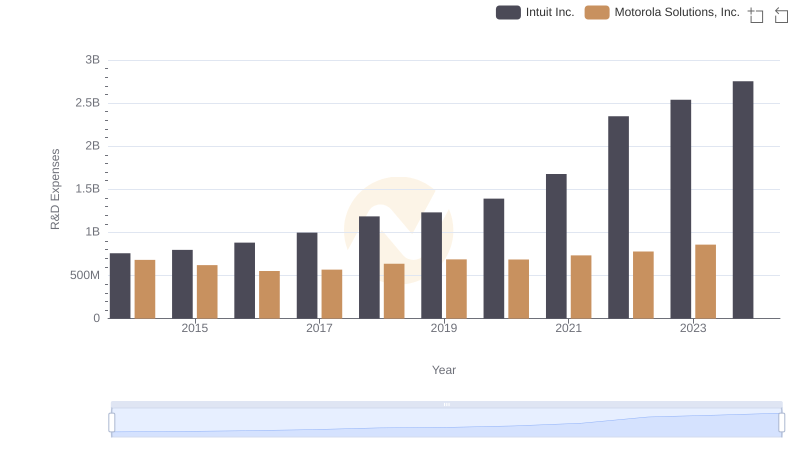
Analyzing R&D Budgets: Intuit Inc. vs Motorola Solutions, Inc.
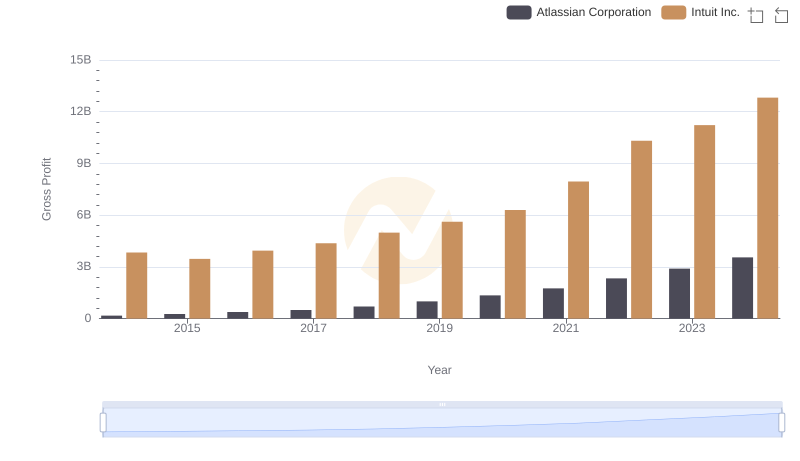
Gross Profit Analysis: Comparing Intuit Inc. and Atlassian Corporation
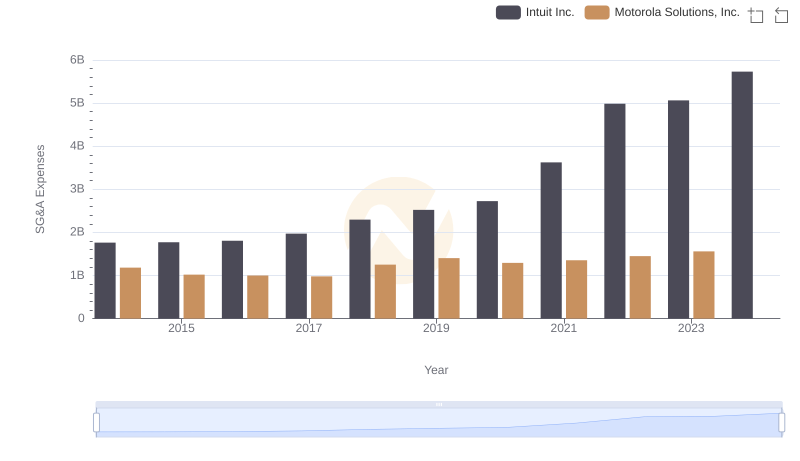
Selling, General, and Administrative Costs: Intuit Inc. vs Motorola Solutions, Inc.