| __timestamp | Intuit Inc. | Marvell Technology, Inc. |
|---|---|---|
| Wednesday, January 1, 2014 | 1762000000 | 259169000 |
| Thursday, January 1, 2015 | 1771000000 | 273982000 |
| Friday, January 1, 2016 | 1807000000 | 280970000 |
| Sunday, January 1, 2017 | 1973000000 | 299727000 |
| Monday, January 1, 2018 | 2298000000 | 238166000 |
| Tuesday, January 1, 2019 | 2524000000 | 424360000 |
| Wednesday, January 1, 2020 | 2727000000 | 464580000 |
| Friday, January 1, 2021 | 3626000000 | 467240000 |
| Saturday, January 1, 2022 | 4986000000 | 955245000 |
| Sunday, January 1, 2023 | 5062000000 | 843600000 |
| Monday, January 1, 2024 | 5730000000 | 834000000 |
Infusing magic into the data realm
In the ever-evolving landscape of technology, operational efficiency is paramount. Over the past decade, Intuit Inc. and Marvell Technology, Inc. have showcased contrasting trajectories in their Selling, General, and Administrative (SG&A) expenses. Intuit's SG&A expenses have surged by over 225% from 2014 to 2024, reflecting its aggressive growth strategy and market expansion. In contrast, Marvell Technology's SG&A expenses have seen a more modest increase of approximately 220%, indicating a steady yet cautious approach to scaling operations.
The year 2022 marked a significant leap for both companies, with Intuit's expenses peaking at nearly 5 billion, while Marvell's expenses approached the 1 billion mark. This divergence highlights Intuit's robust investment in innovation and customer acquisition, while Marvell focuses on strategic partnerships and technological advancements. As we look to the future, these trends offer a glimpse into the strategic priorities shaping the tech giants of tomorrow.
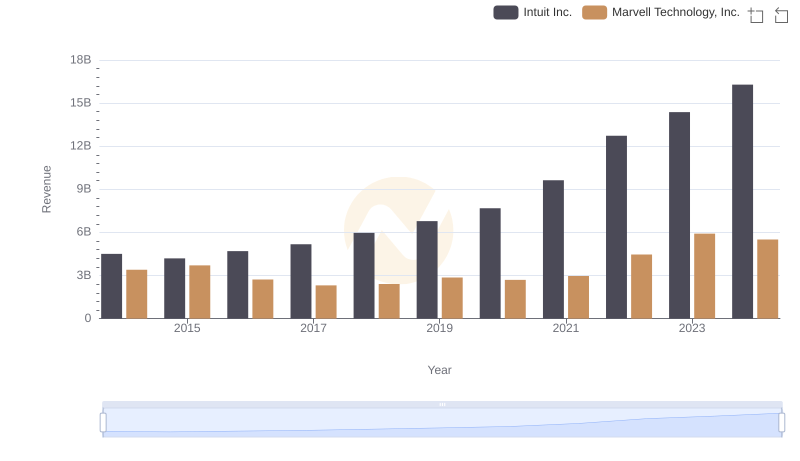
Intuit Inc. vs Marvell Technology, Inc.: Annual Revenue Growth Compared
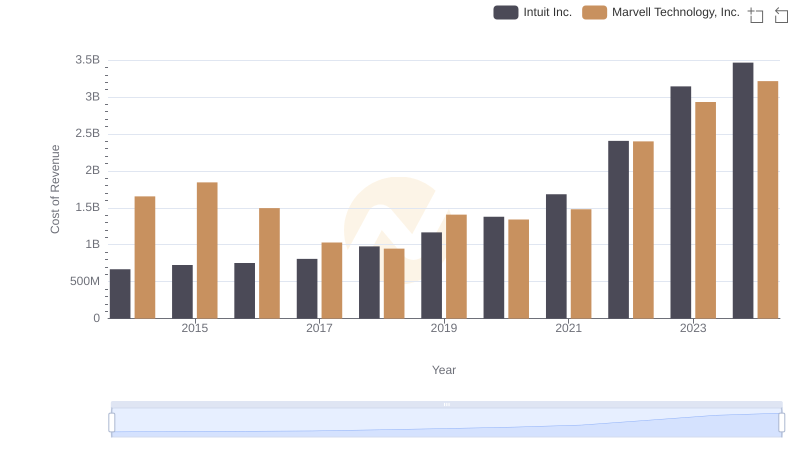
Cost of Revenue Comparison: Intuit Inc. vs Marvell Technology, Inc.
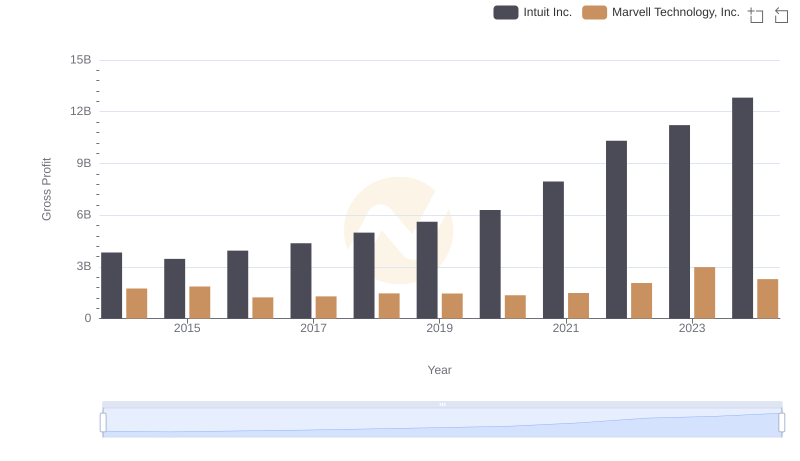
Gross Profit Analysis: Comparing Intuit Inc. and Marvell Technology, Inc.
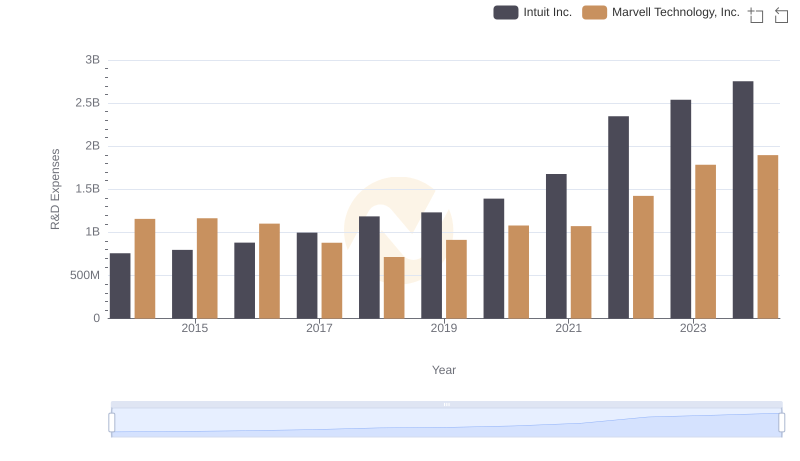
Research and Development Expenses Breakdown: Intuit Inc. vs Marvell Technology, Inc.
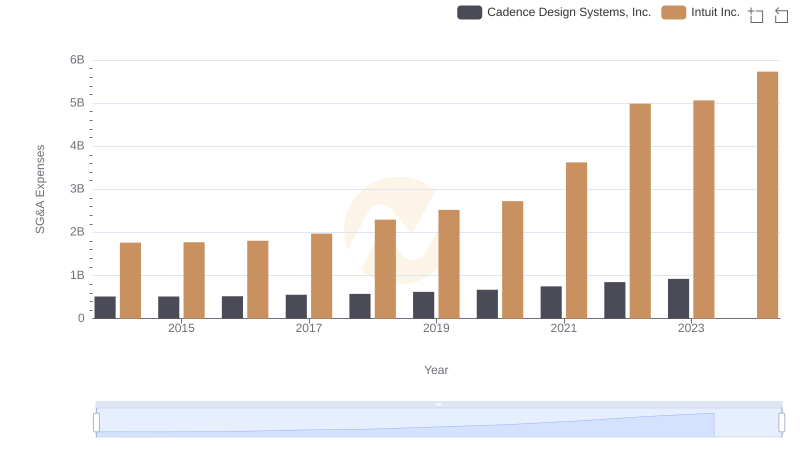
Operational Costs Compared: SG&A Analysis of Intuit Inc. and Cadence Design Systems, Inc.
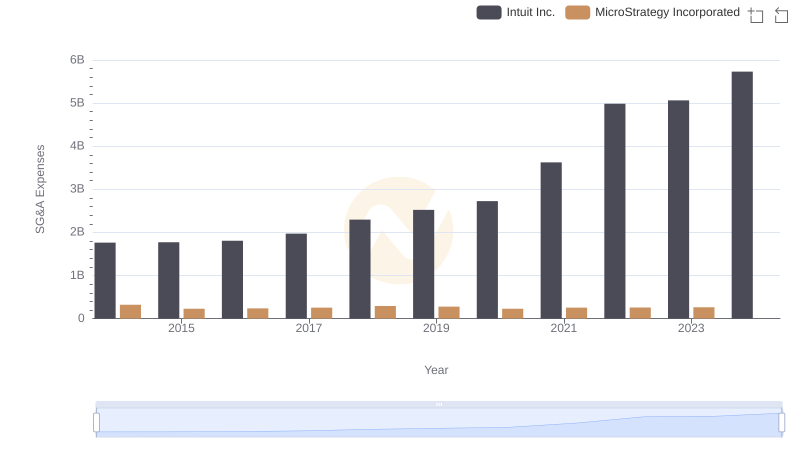
Intuit Inc. and MicroStrategy Incorporated: SG&A Spending Patterns Compared
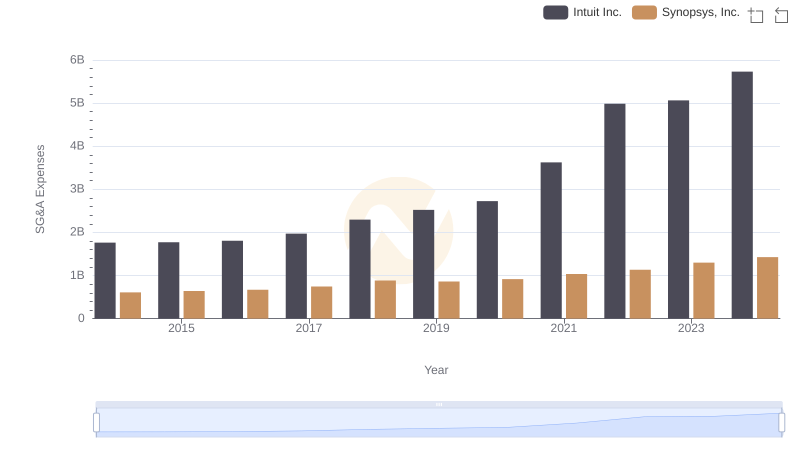
Who Optimizes SG&A Costs Better? Intuit Inc. or Synopsys, Inc.
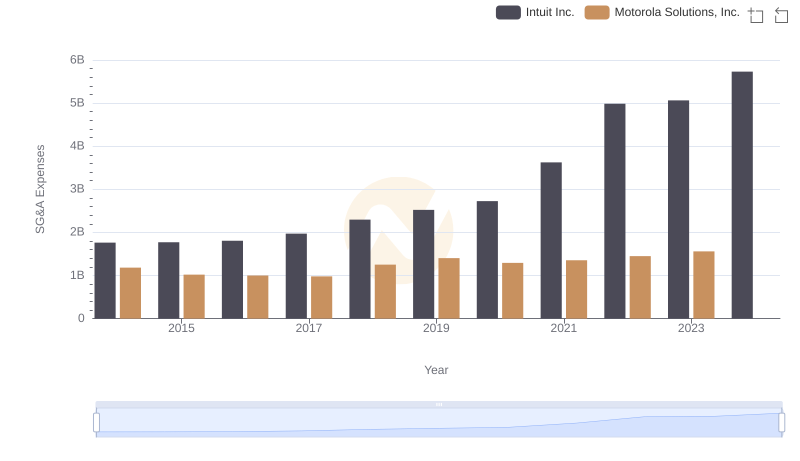
Selling, General, and Administrative Costs: Intuit Inc. vs Motorola Solutions, Inc.
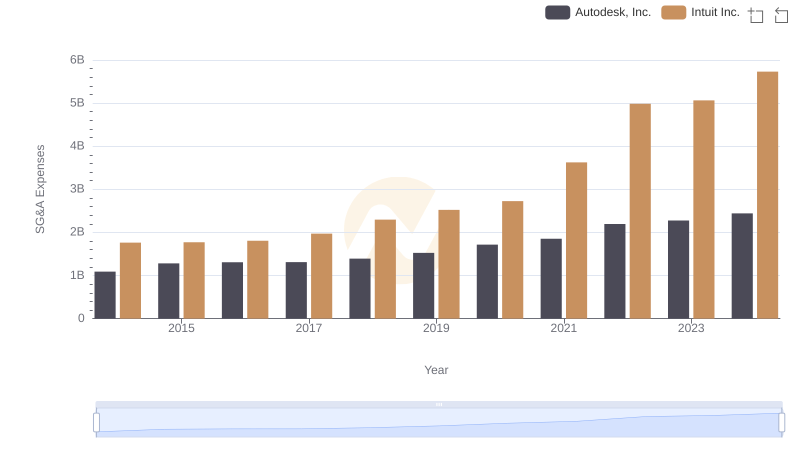
Intuit Inc. vs Autodesk, Inc.: SG&A Expense Trends
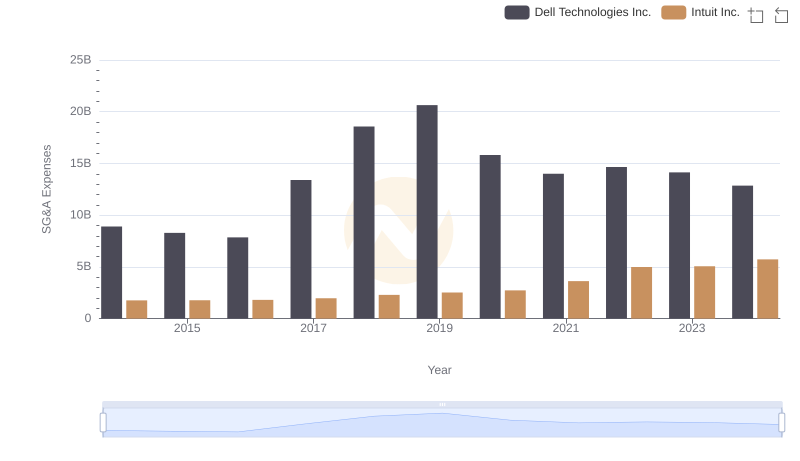
Operational Costs Compared: SG&A Analysis of Intuit Inc. and Dell Technologies Inc.
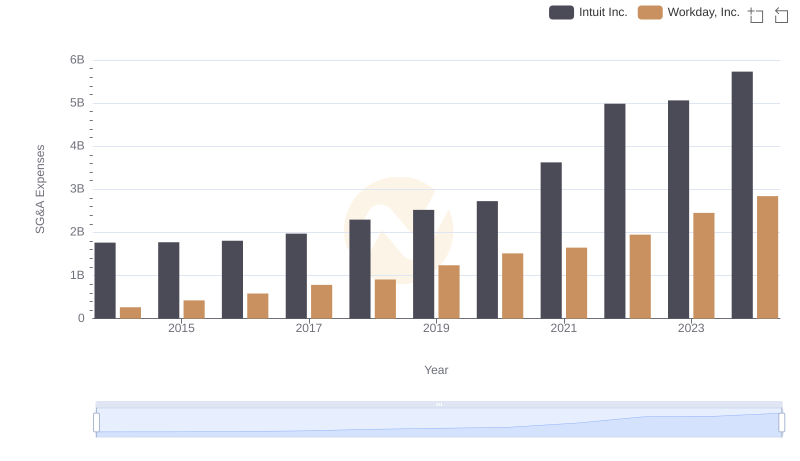
Intuit Inc. and Workday, Inc.: SG&A Spending Patterns Compared
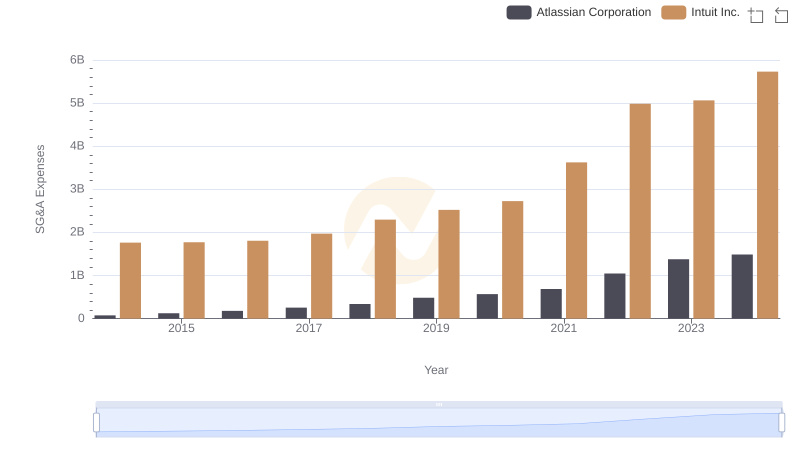
Who Optimizes SG&A Costs Better? Intuit Inc. or Atlassian Corporation