| __timestamp | Amphenol Corporation | Intuit Inc. |
|---|---|---|
| Wednesday, January 1, 2014 | 1693800000 | 3838000000 |
| Thursday, January 1, 2015 | 1779500000 | 3467000000 |
| Friday, January 1, 2016 | 2040000000 | 3942000000 |
| Sunday, January 1, 2017 | 2309900000 | 4368000000 |
| Monday, January 1, 2018 | 2654900000 | 4987000000 |
| Tuesday, January 1, 2019 | 2616000000 | 5617000000 |
| Wednesday, January 1, 2020 | 2664100000 | 6301000000 |
| Friday, January 1, 2021 | 3401800000 | 7950000000 |
| Saturday, January 1, 2022 | 4028200000 | 10320000000 |
| Sunday, January 1, 2023 | 4084100000 | 11225000000 |
| Monday, January 1, 2024 | 5139700000 | 12820000000 |
Data in motion
In the ever-evolving landscape of technology and electronics, Intuit Inc. and Amphenol Corporation have emerged as formidable players. Over the past decade, from 2014 to 2024, these companies have demonstrated remarkable growth in gross profit, reflecting their strategic prowess and market adaptability.
Intuit Inc., a leader in financial software, has seen its gross profit soar by approximately 234%, from $3.8 billion in 2014 to an impressive $12.8 billion in 2024. This growth underscores Intuit's successful expansion and innovation in the digital finance sector.
Meanwhile, Amphenol Corporation, a key player in the electronics industry, has also experienced significant growth. Its gross profit increased by around 204%, from $1.7 billion in 2014 to $5.1 billion in 2024. This growth highlights Amphenol's ability to adapt and thrive in a competitive market.
Both companies exemplify the dynamic nature of their respective industries, showcasing resilience and strategic foresight.
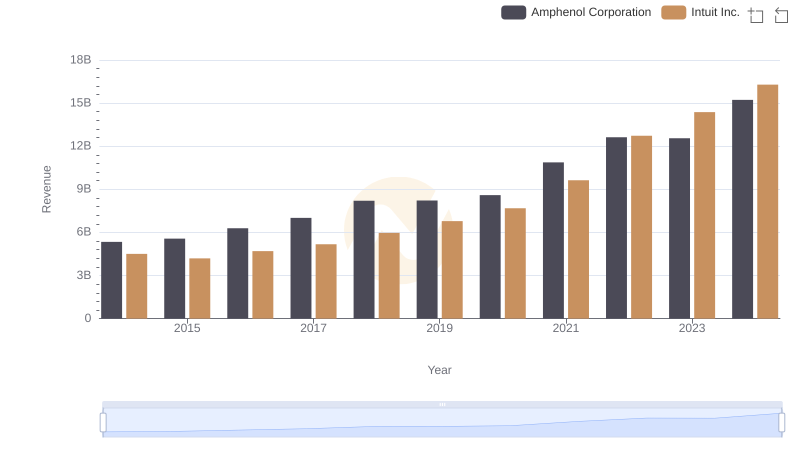
Revenue Insights: Intuit Inc. and Amphenol Corporation Performance Compared
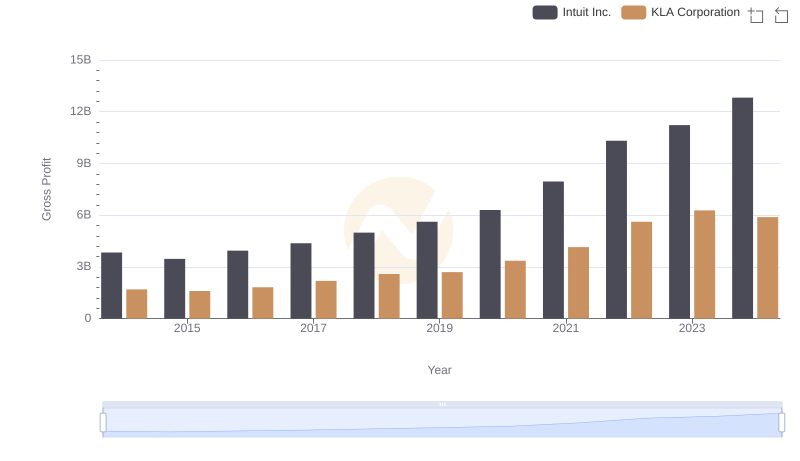
Intuit Inc. and KLA Corporation: A Detailed Gross Profit Analysis
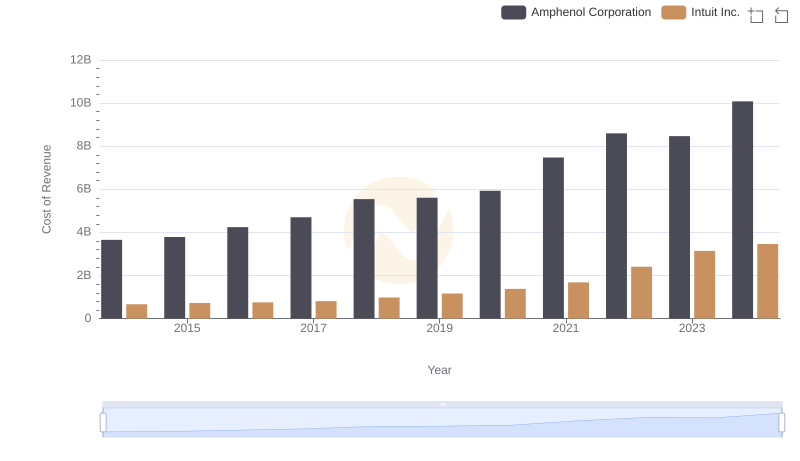
Analyzing Cost of Revenue: Intuit Inc. and Amphenol Corporation
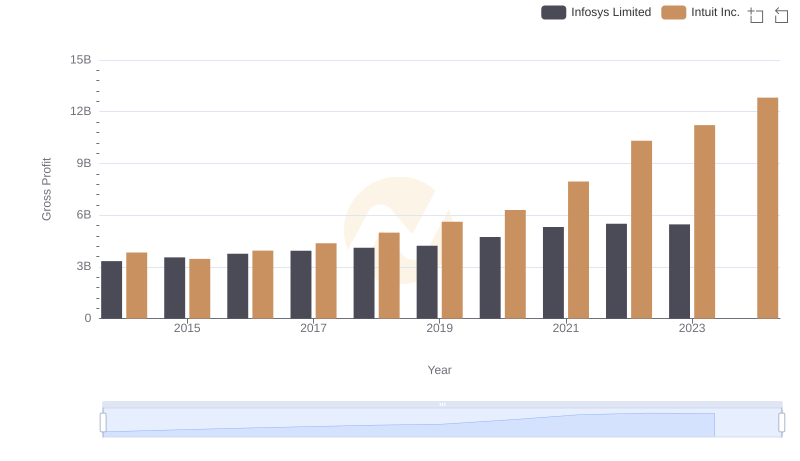
Gross Profit Trends Compared: Intuit Inc. vs Infosys Limited
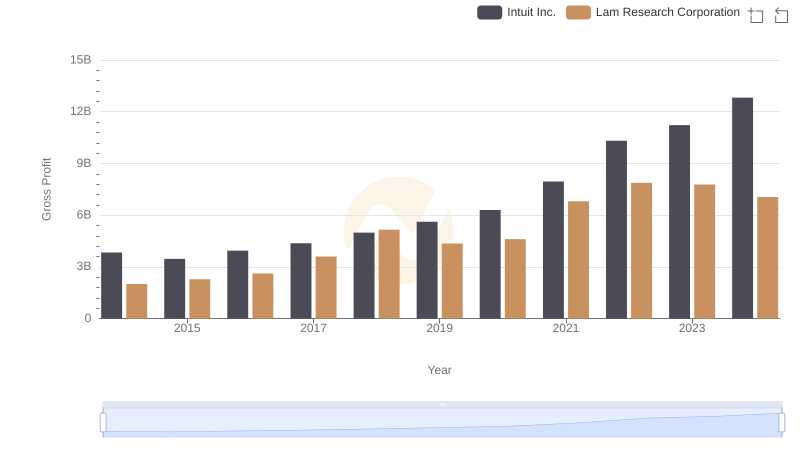
Gross Profit Comparison: Intuit Inc. and Lam Research Corporation Trends
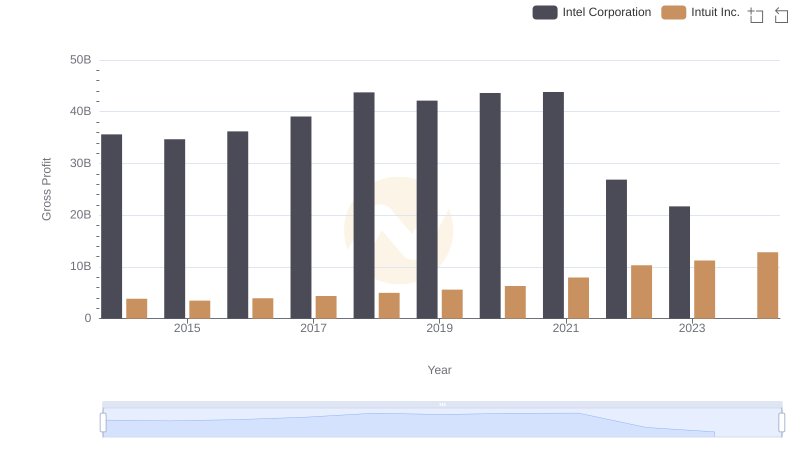
Intuit Inc. vs Intel Corporation: A Gross Profit Performance Breakdown
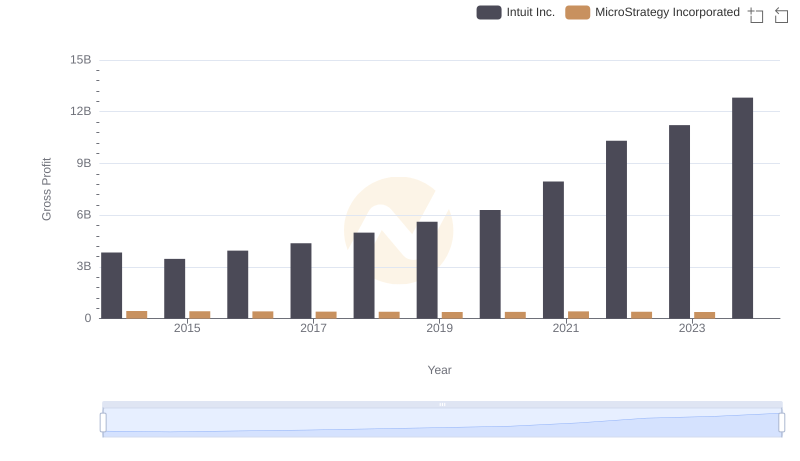
Gross Profit Comparison: Intuit Inc. and MicroStrategy Incorporated Trends
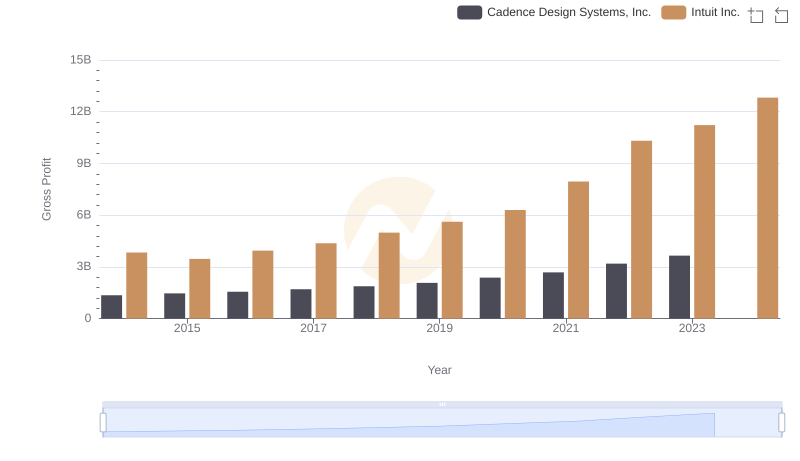
Key Insights on Gross Profit: Intuit Inc. vs Cadence Design Systems, Inc.
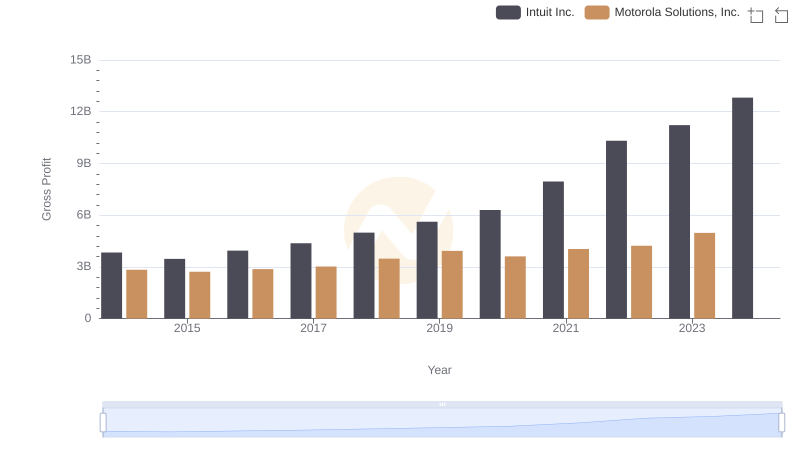
Intuit Inc. and Motorola Solutions, Inc.: A Detailed Gross Profit Analysis
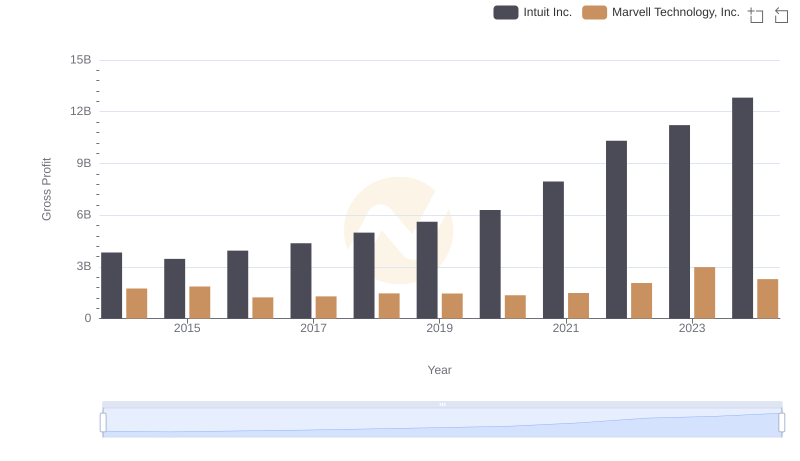
Gross Profit Analysis: Comparing Intuit Inc. and Marvell Technology, Inc.
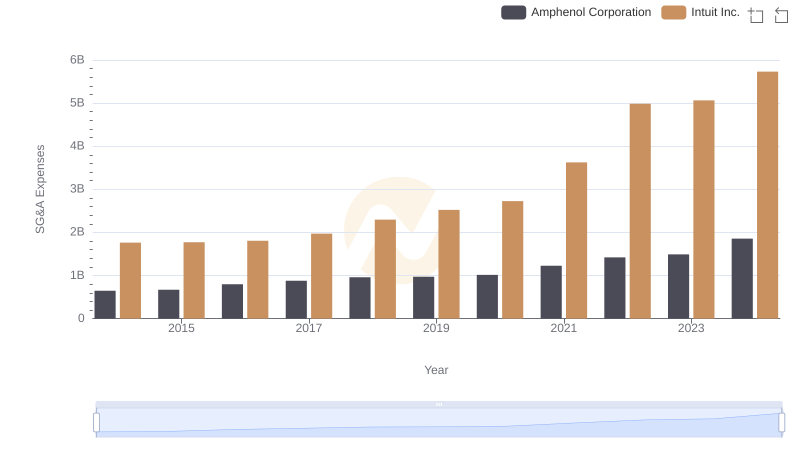
Who Optimizes SG&A Costs Better? Intuit Inc. or Amphenol Corporation
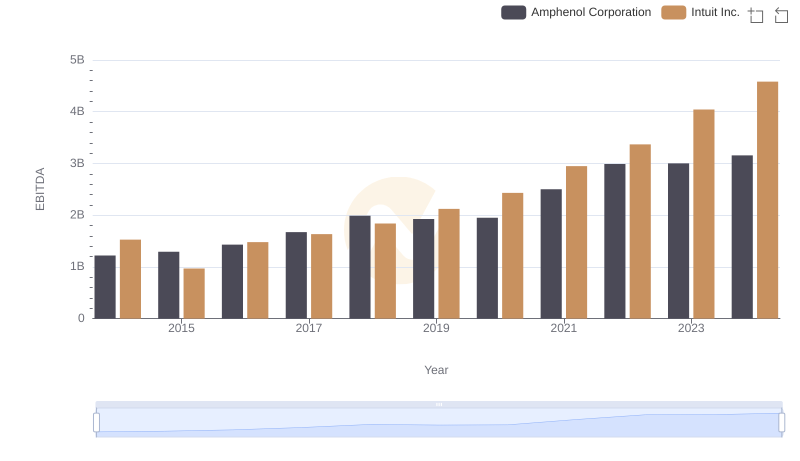
A Side-by-Side Analysis of EBITDA: Intuit Inc. and Amphenol Corporation