| __timestamp | Cadence Design Systems, Inc. | Intuit Inc. |
|---|---|---|
| Wednesday, January 1, 2014 | 1357226000 | 3838000000 |
| Thursday, January 1, 2015 | 1463638000 | 3467000000 |
| Friday, January 1, 2016 | 1559591000 | 3942000000 |
| Sunday, January 1, 2017 | 1705642000 | 4368000000 |
| Monday, January 1, 2018 | 1879275000 | 4987000000 |
| Tuesday, January 1, 2019 | 2069962000 | 5617000000 |
| Wednesday, January 1, 2020 | 2377393000 | 6301000000 |
| Friday, January 1, 2021 | 2681238000 | 7950000000 |
| Saturday, January 1, 2022 | 3190095000 | 10320000000 |
| Sunday, January 1, 2023 | 3654945000 | 11225000000 |
| Monday, January 1, 2024 | 4430362000 | 12820000000 |
Cracking the code
In the ever-evolving landscape of technology, financial performance is a key indicator of a company's resilience and innovation. Over the past decade, Intuit Inc. and Cadence Design Systems, Inc. have demonstrated remarkable growth in their gross profits. From 2014 to 2023, Intuit Inc. has seen its gross profit soar by approximately 193%, reaching a staggering $11.225 billion in 2023. Meanwhile, Cadence Design Systems, Inc. has experienced a robust 169% increase, culminating in a gross profit of $3.655 billion in the same year.
This upward trajectory highlights the strategic prowess of both companies in navigating market challenges and capitalizing on opportunities. While Intuit's growth outpaces Cadence's, both companies have shown resilience and adaptability. The data for 2024 is incomplete, but the trends suggest continued prosperity for these industry leaders.
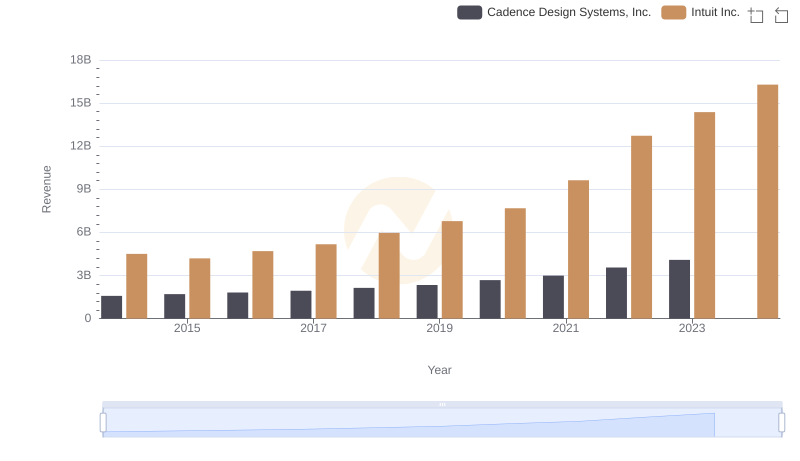
Who Generates More Revenue? Intuit Inc. or Cadence Design Systems, Inc.
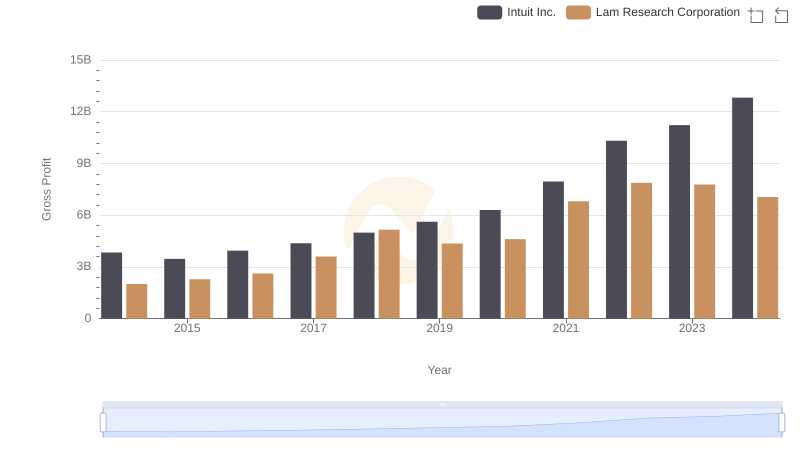
Gross Profit Comparison: Intuit Inc. and Lam Research Corporation Trends
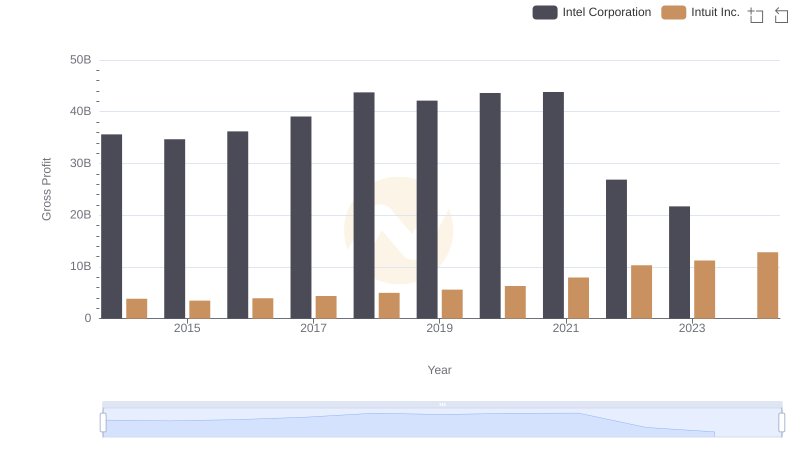
Intuit Inc. vs Intel Corporation: A Gross Profit Performance Breakdown
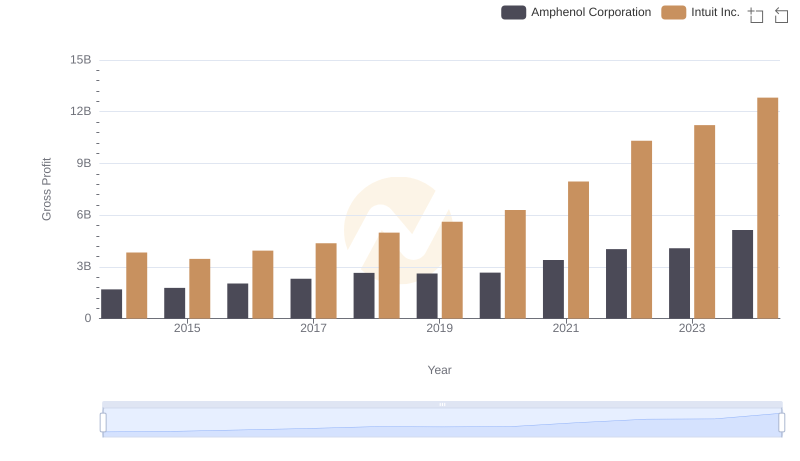
Gross Profit Analysis: Comparing Intuit Inc. and Amphenol Corporation
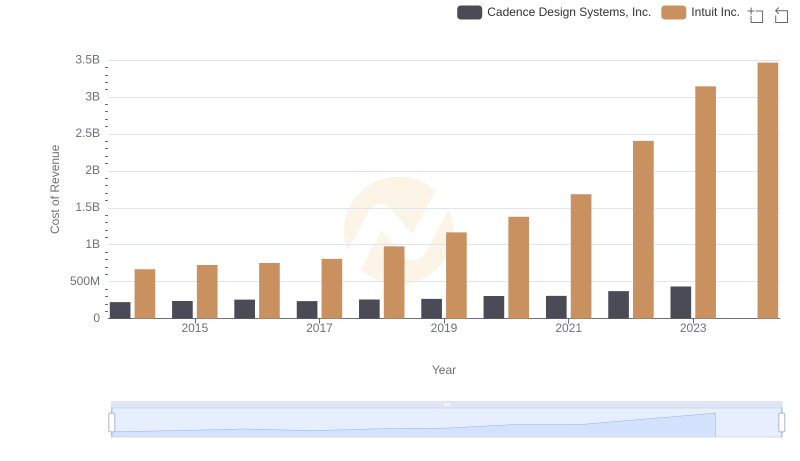
Cost of Revenue Trends: Intuit Inc. vs Cadence Design Systems, Inc.
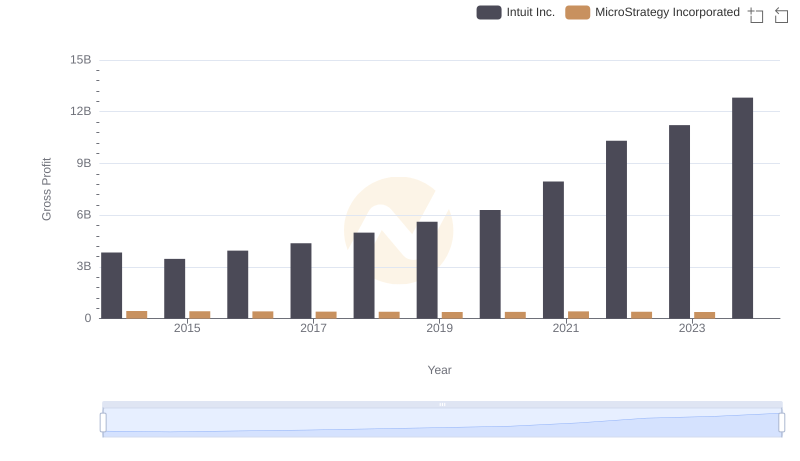
Gross Profit Comparison: Intuit Inc. and MicroStrategy Incorporated Trends
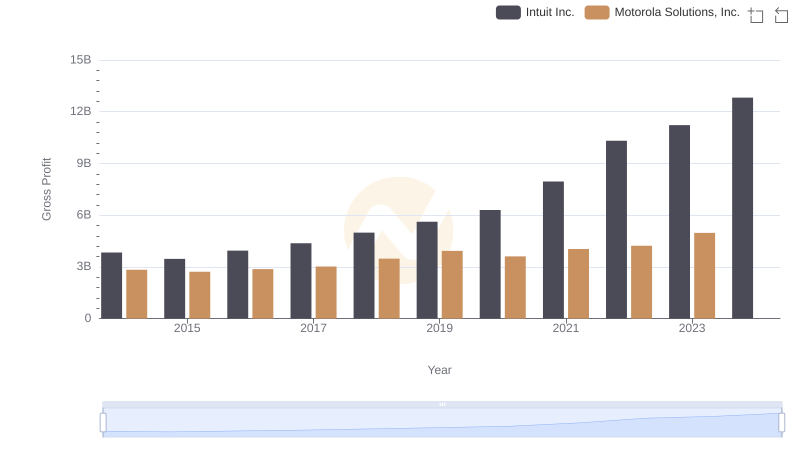
Intuit Inc. and Motorola Solutions, Inc.: A Detailed Gross Profit Analysis
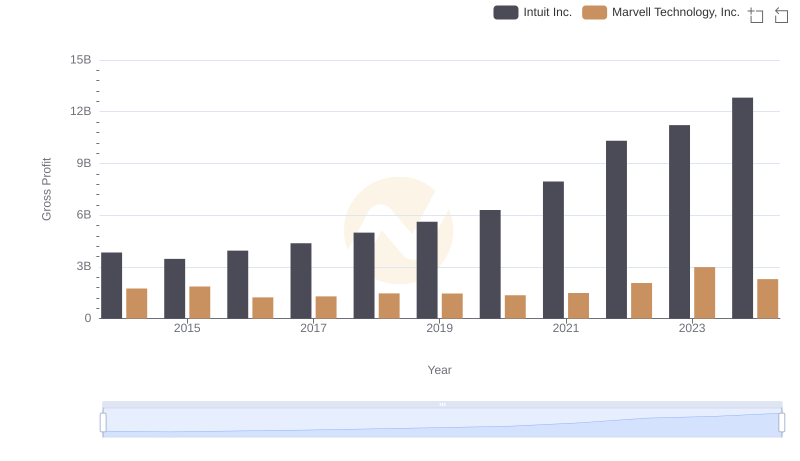
Gross Profit Analysis: Comparing Intuit Inc. and Marvell Technology, Inc.
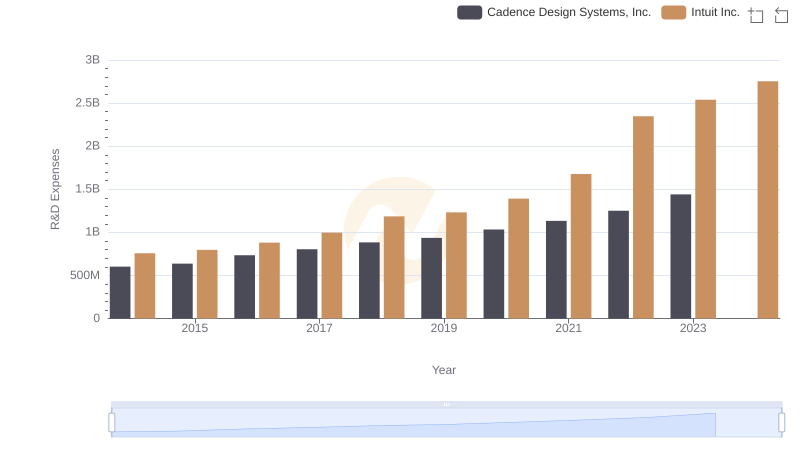
Comparing Innovation Spending: Intuit Inc. and Cadence Design Systems, Inc.
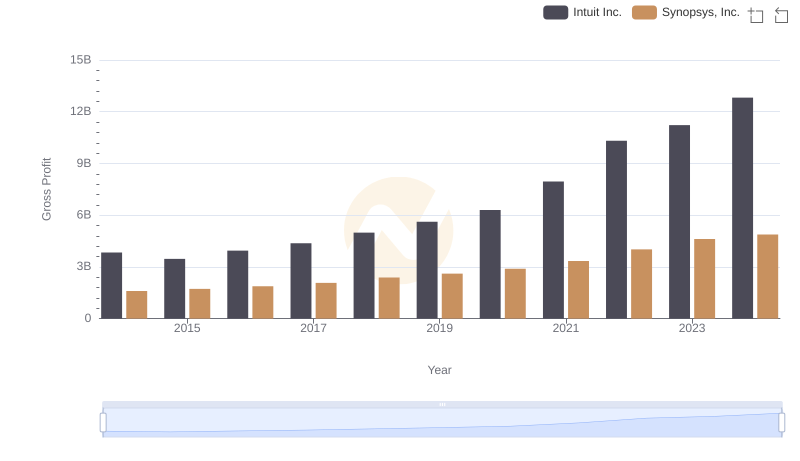
Intuit Inc. and Synopsys, Inc.: A Detailed Gross Profit Analysis
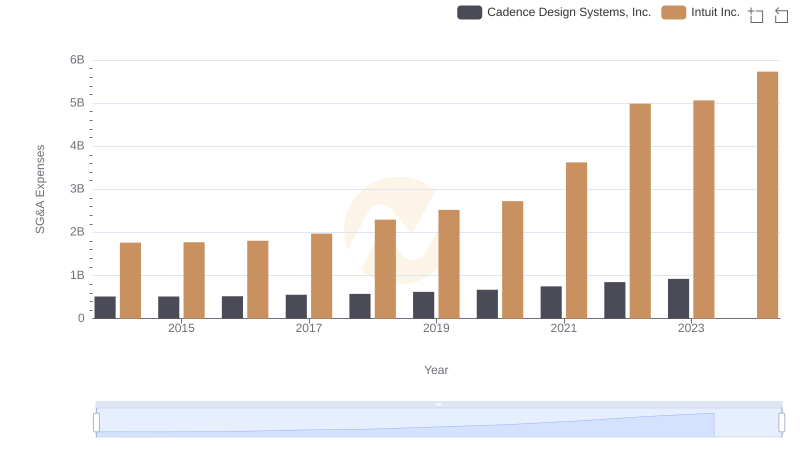
Operational Costs Compared: SG&A Analysis of Intuit Inc. and Cadence Design Systems, Inc.
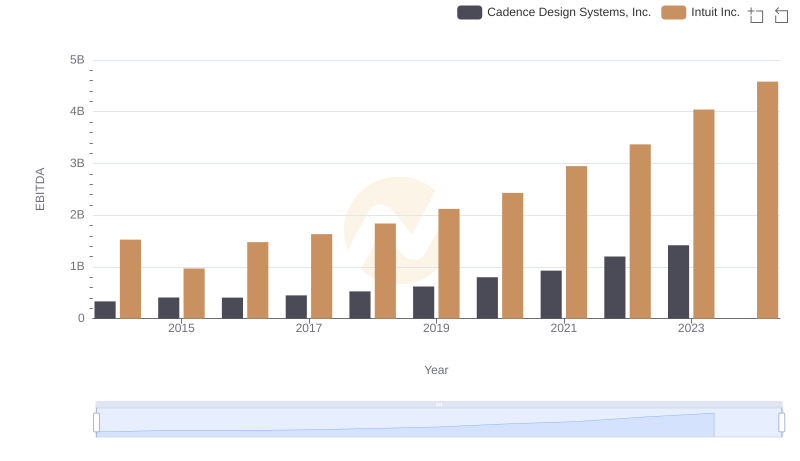
Comparative EBITDA Analysis: Intuit Inc. vs Cadence Design Systems, Inc.