| __timestamp | Intuit Inc. | MicroStrategy Incorporated |
|---|---|---|
| Wednesday, January 1, 2014 | 3838000000 | 444620000 |
| Thursday, January 1, 2015 | 3467000000 | 428761000 |
| Friday, January 1, 2016 | 3942000000 | 419014000 |
| Sunday, January 1, 2017 | 4368000000 | 407894000 |
| Monday, January 1, 2018 | 4987000000 | 398139000 |
| Tuesday, January 1, 2019 | 5617000000 | 386353000 |
| Wednesday, January 1, 2020 | 6301000000 | 389680000 |
| Friday, January 1, 2021 | 7950000000 | 418853000 |
| Saturday, January 1, 2022 | 10320000000 | 396275000 |
| Sunday, January 1, 2023 | 11225000000 | 386317000 |
| Monday, January 1, 2024 | 12820000000 | 333988000 |
Igniting the spark of knowledge
In the ever-evolving landscape of technology, financial performance is a key indicator of a company's resilience and growth. Over the past decade, Intuit Inc. has demonstrated a remarkable upward trajectory in gross profit, growing by approximately 234% from 2014 to 2023. This growth reflects Intuit's strategic innovations and market adaptability, positioning it as a leader in financial software solutions.
Conversely, MicroStrategy Incorporated has experienced a more stable yet modest performance, with gross profits fluctuating around the $400 million mark. This stability suggests a consistent market presence, albeit without the explosive growth seen in Intuit.
The data from 2024 is incomplete, highlighting the dynamic nature of financial forecasting. As we look to the future, these trends underscore the importance of strategic agility and innovation in maintaining competitive advantage in the tech industry.
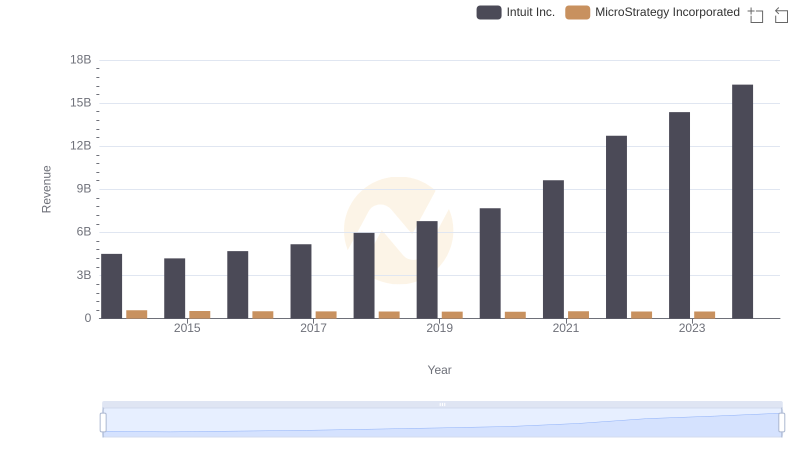
Revenue Showdown: Intuit Inc. vs MicroStrategy Incorporated
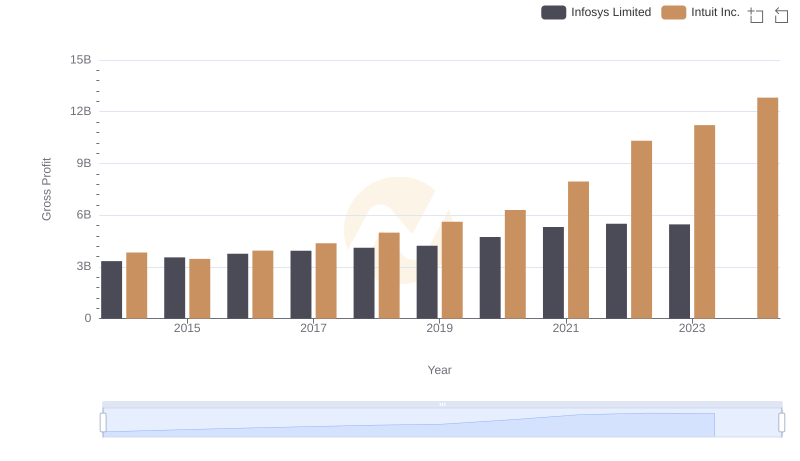
Gross Profit Trends Compared: Intuit Inc. vs Infosys Limited
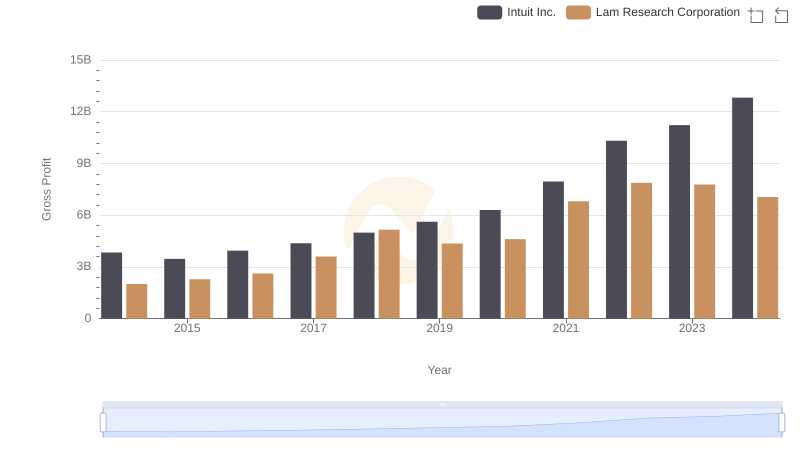
Gross Profit Comparison: Intuit Inc. and Lam Research Corporation Trends
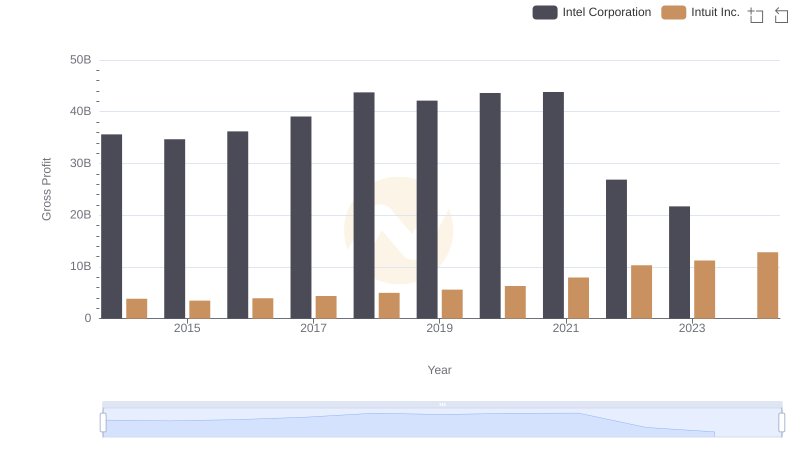
Intuit Inc. vs Intel Corporation: A Gross Profit Performance Breakdown
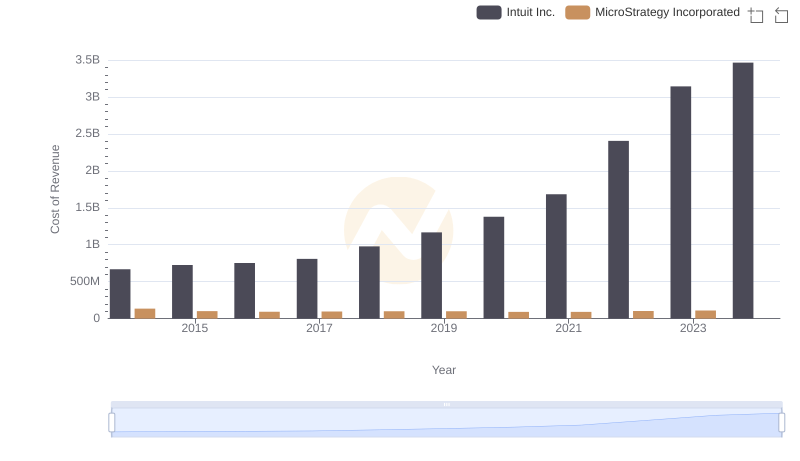
Analyzing Cost of Revenue: Intuit Inc. and MicroStrategy Incorporated
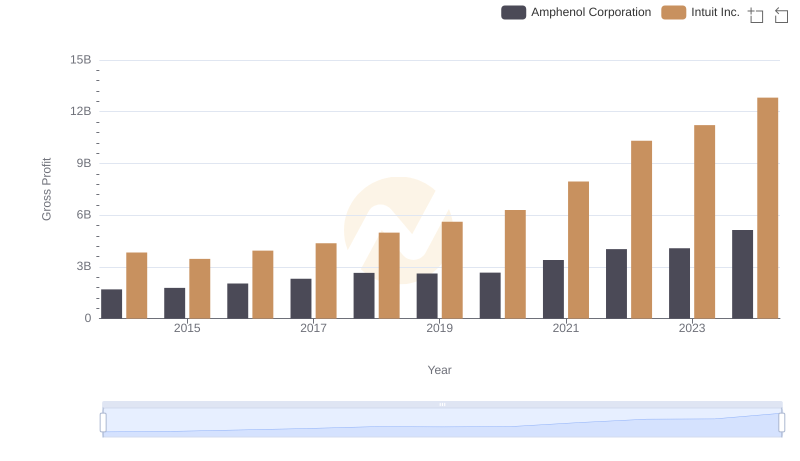
Gross Profit Analysis: Comparing Intuit Inc. and Amphenol Corporation
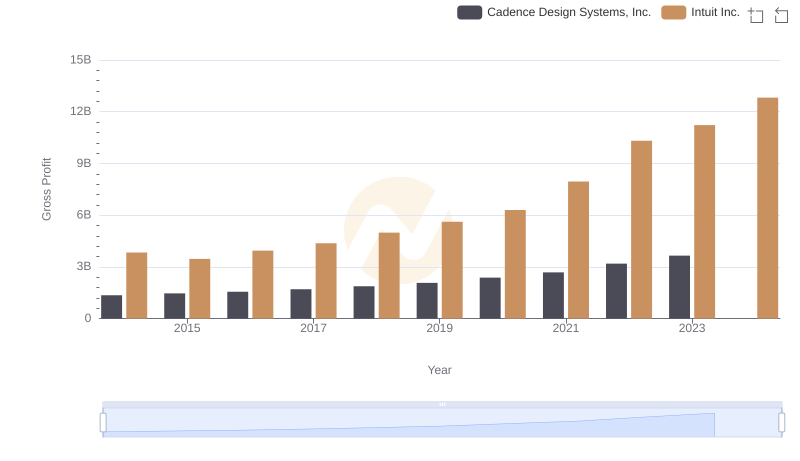
Key Insights on Gross Profit: Intuit Inc. vs Cadence Design Systems, Inc.
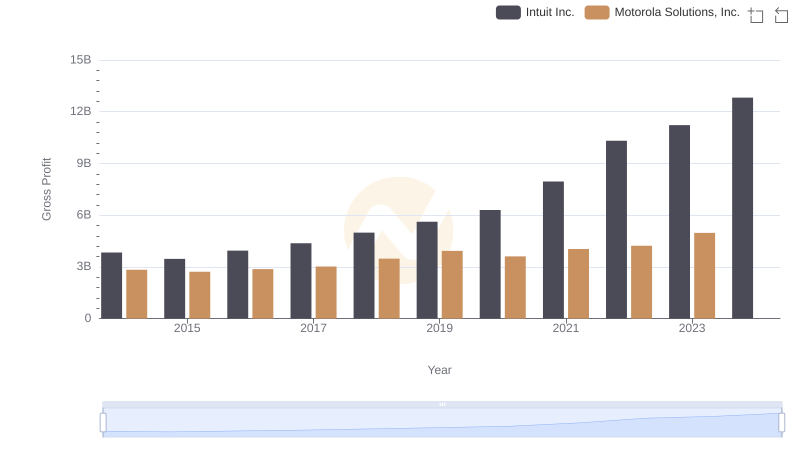
Intuit Inc. and Motorola Solutions, Inc.: A Detailed Gross Profit Analysis
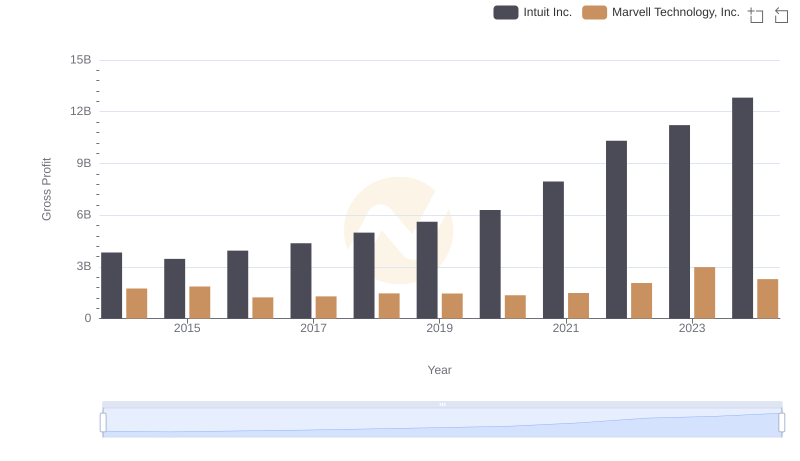
Gross Profit Analysis: Comparing Intuit Inc. and Marvell Technology, Inc.
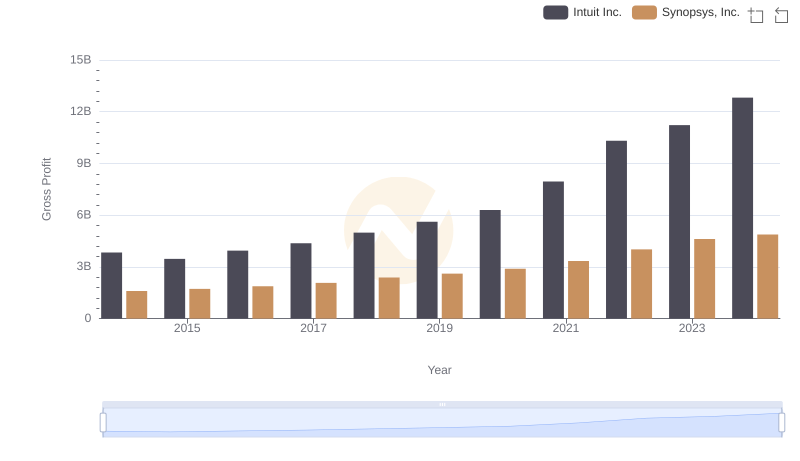
Intuit Inc. and Synopsys, Inc.: A Detailed Gross Profit Analysis
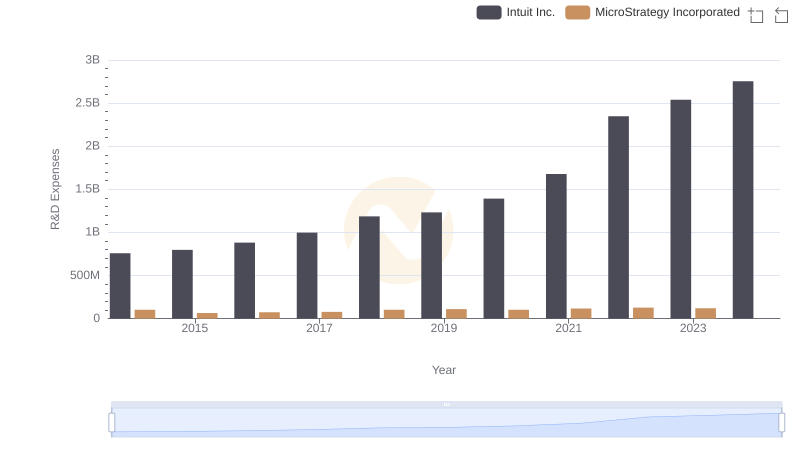
Intuit Inc. or MicroStrategy Incorporated: Who Invests More in Innovation?
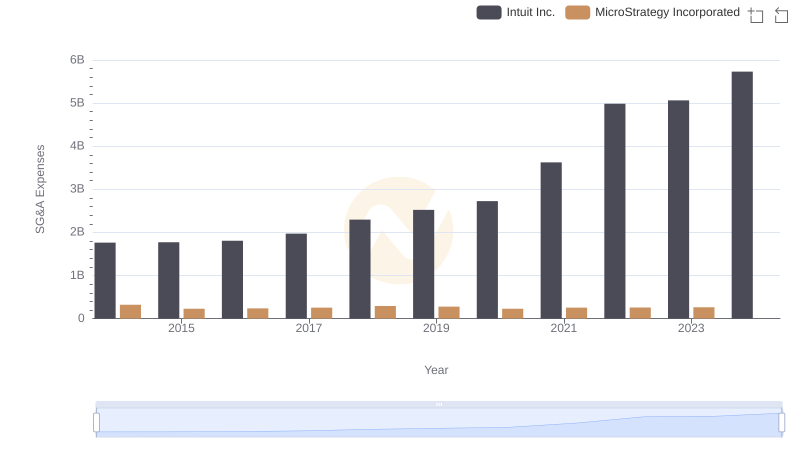
Intuit Inc. and MicroStrategy Incorporated: SG&A Spending Patterns Compared