| __timestamp | Intuit Inc. | Marvell Technology, Inc. |
|---|---|---|
| Wednesday, January 1, 2014 | 4506000000 | 3404400000 |
| Thursday, January 1, 2015 | 4192000000 | 3706963000 |
| Friday, January 1, 2016 | 4694000000 | 2725828000 |
| Sunday, January 1, 2017 | 5177000000 | 2317674000 |
| Monday, January 1, 2018 | 5964000000 | 2409170000 |
| Tuesday, January 1, 2019 | 6784000000 | 2865791000 |
| Wednesday, January 1, 2020 | 7679000000 | 2699161000 |
| Friday, January 1, 2021 | 9633000000 | 2968900000 |
| Saturday, January 1, 2022 | 12726000000 | 4462383000 |
| Sunday, January 1, 2023 | 14368000000 | 5919600000 |
| Monday, January 1, 2024 | 16285000000 | 5507700000 |
Unveiling the hidden dimensions of data
In the ever-evolving landscape of technology, Intuit Inc. and Marvell Technology, Inc. have showcased distinct trajectories over the past decade. From 2014 to 2024, Intuit's revenue has surged by approximately 261%, reflecting its robust growth strategy and market adaptability. In contrast, Marvell Technology, Inc. has experienced a more modest increase of around 62% during the same period.
This comparison not only illustrates the dynamic nature of tech companies but also emphasizes the importance of strategic innovation in sustaining growth.
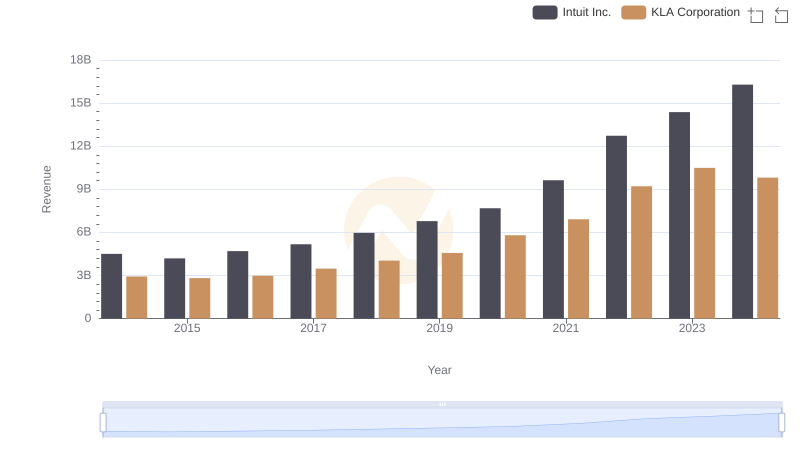
Revenue Showdown: Intuit Inc. vs KLA Corporation
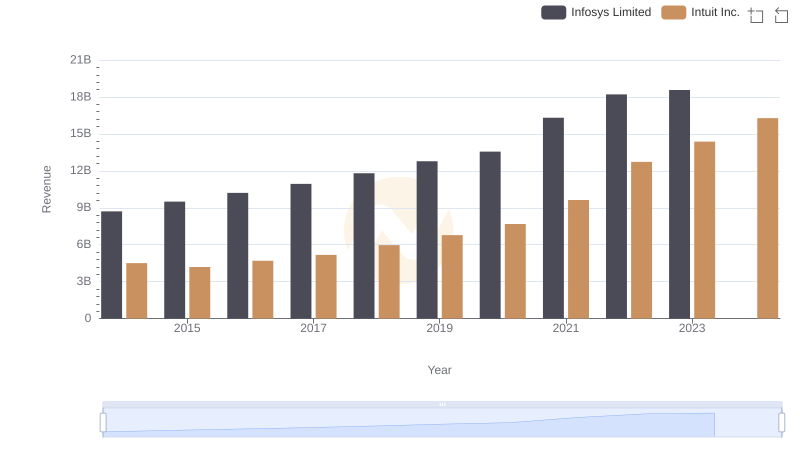
Revenue Showdown: Intuit Inc. vs Infosys Limited
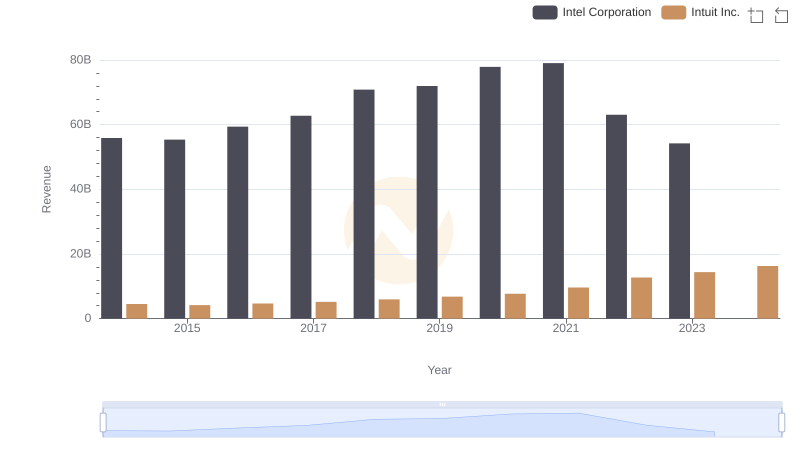
Breaking Down Revenue Trends: Intuit Inc. vs Intel Corporation
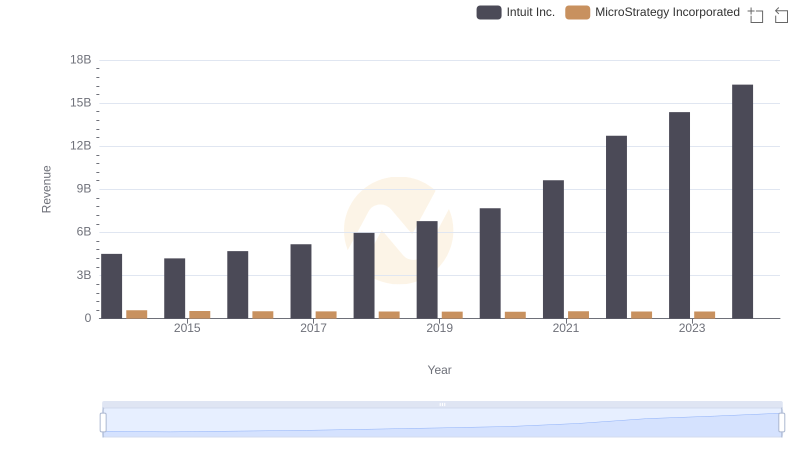
Revenue Showdown: Intuit Inc. vs MicroStrategy Incorporated
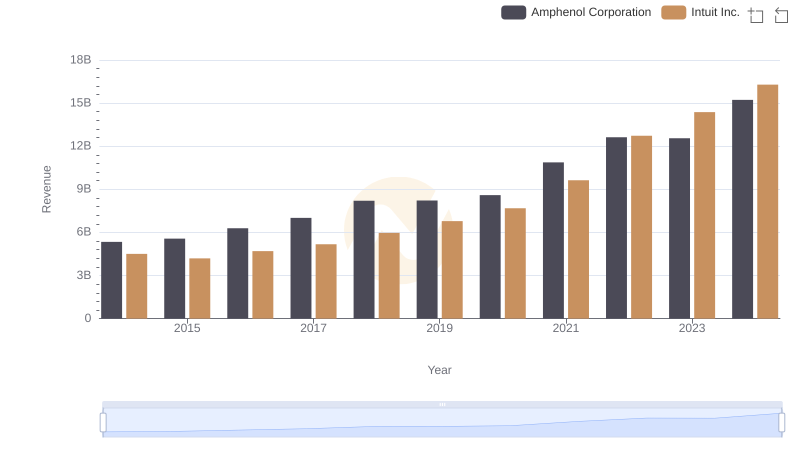
Revenue Insights: Intuit Inc. and Amphenol Corporation Performance Compared
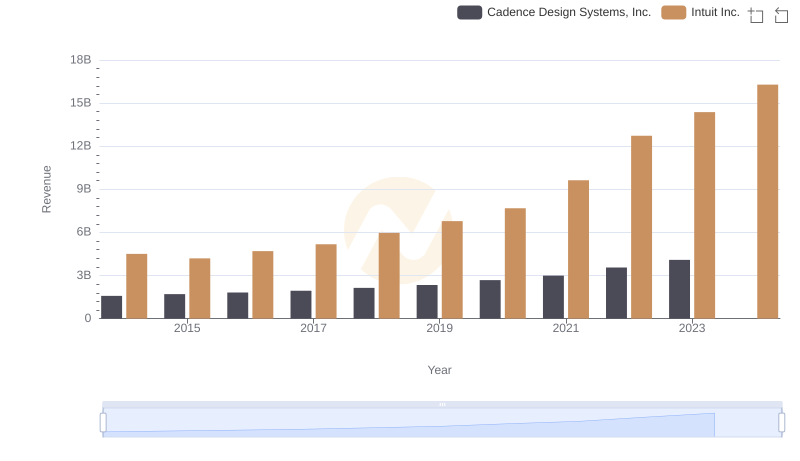
Who Generates More Revenue? Intuit Inc. or Cadence Design Systems, Inc.
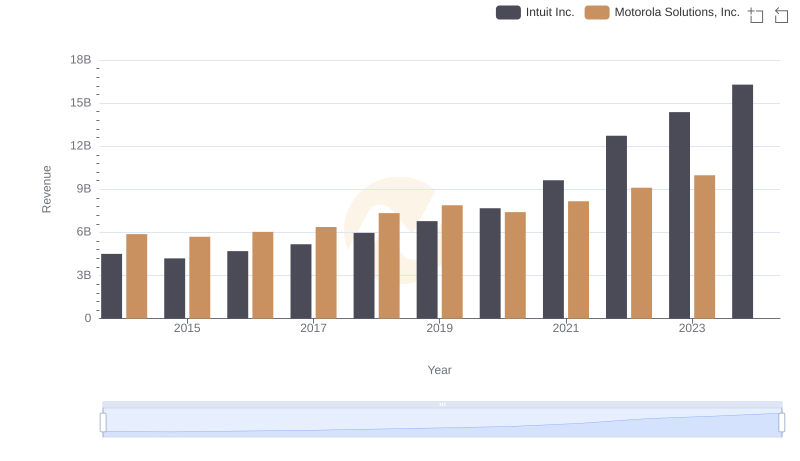
Breaking Down Revenue Trends: Intuit Inc. vs Motorola Solutions, Inc.
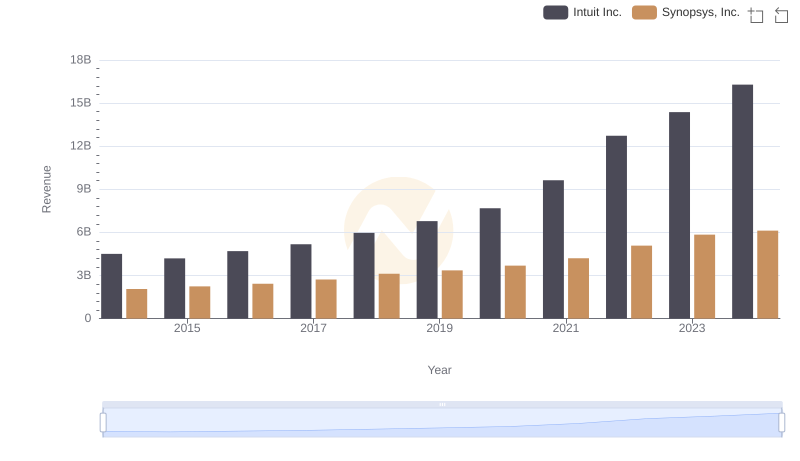
Intuit Inc. vs Synopsys, Inc.: Annual Revenue Growth Compared
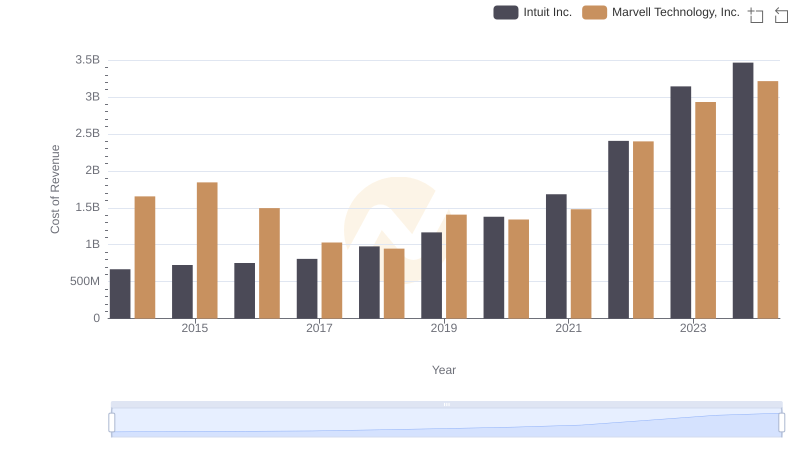
Cost of Revenue Comparison: Intuit Inc. vs Marvell Technology, Inc.
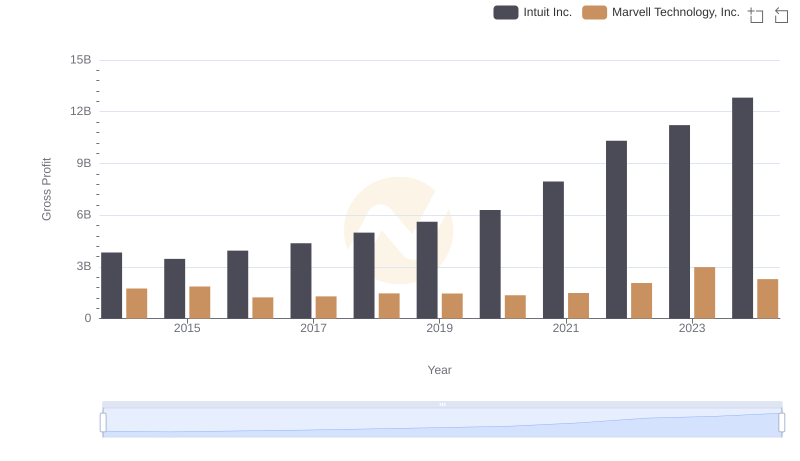
Gross Profit Analysis: Comparing Intuit Inc. and Marvell Technology, Inc.
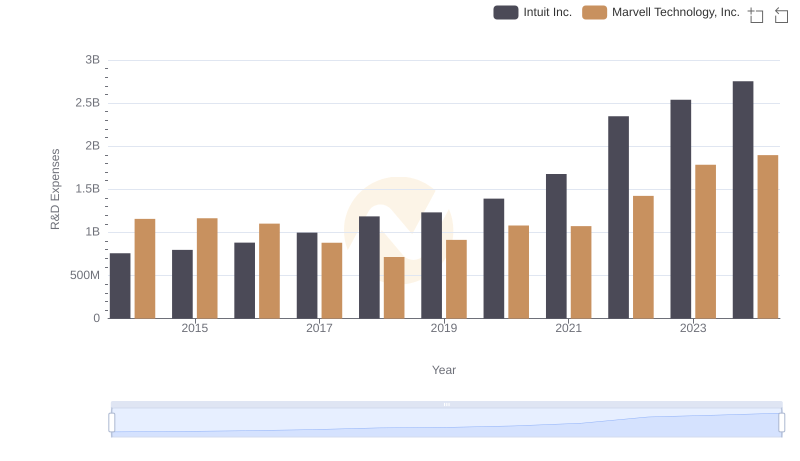
Research and Development Expenses Breakdown: Intuit Inc. vs Marvell Technology, Inc.
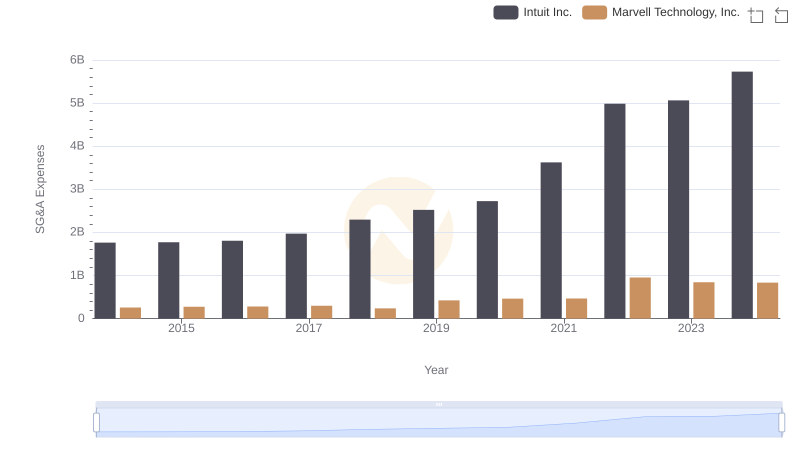
Operational Costs Compared: SG&A Analysis of Intuit Inc. and Marvell Technology, Inc.