| __timestamp | Intuit Inc. | Synopsys, Inc. |
|---|---|---|
| Wednesday, January 1, 2014 | 3838000000 | 1600587000 |
| Thursday, January 1, 2015 | 3467000000 | 1723291000 |
| Friday, January 1, 2016 | 3942000000 | 1879570000 |
| Sunday, January 1, 2017 | 4368000000 | 2070696000 |
| Monday, January 1, 2018 | 4987000000 | 2385160000 |
| Tuesday, January 1, 2019 | 5617000000 | 2607748000 |
| Wednesday, January 1, 2020 | 6301000000 | 2890591000 |
| Friday, January 1, 2021 | 7950000000 | 3342416000 |
| Saturday, January 1, 2022 | 10320000000 | 4017845000 |
| Sunday, January 1, 2023 | 11225000000 | 4620426000 |
| Monday, January 1, 2024 | 12820000000 | 4882147000 |
Unleashing the power of data
In the ever-evolving landscape of technology, Intuit Inc. and Synopsys, Inc. have demonstrated remarkable growth in their gross profits over the past decade. From 2014 to 2024, Intuit's gross profit surged by an impressive 234%, reflecting its robust business model and strategic innovations. Meanwhile, Synopsys, a leader in electronic design automation, saw its gross profit grow by 205%, underscoring its pivotal role in the semiconductor industry.
This analysis not only highlights the financial prowess of these companies but also their strategic foresight in navigating the tech industry's challenges.
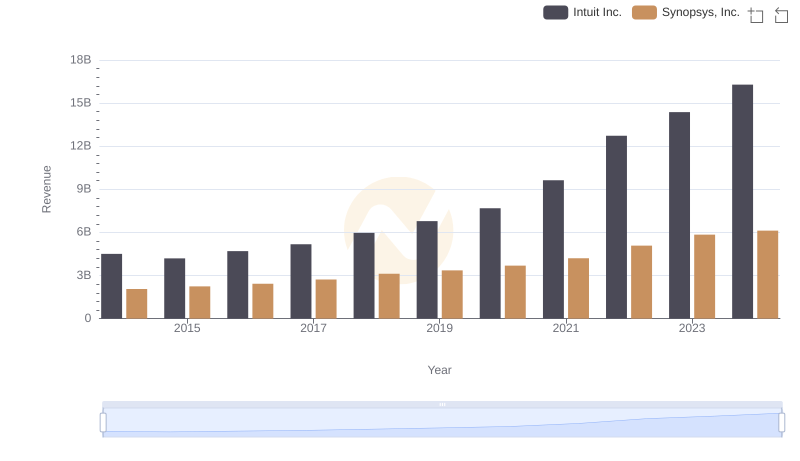
Intuit Inc. vs Synopsys, Inc.: Annual Revenue Growth Compared
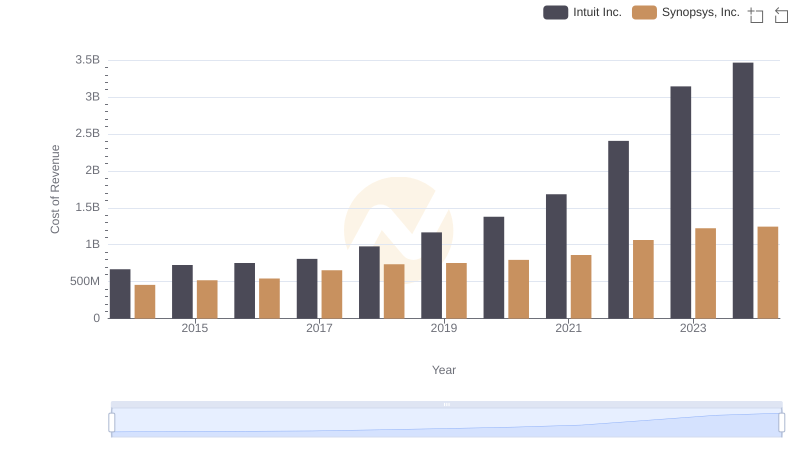
Comparing Cost of Revenue Efficiency: Intuit Inc. vs Synopsys, Inc.
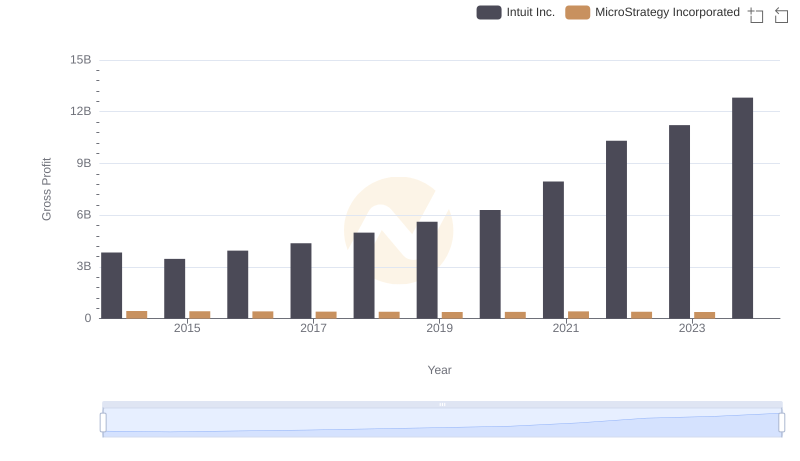
Gross Profit Comparison: Intuit Inc. and MicroStrategy Incorporated Trends
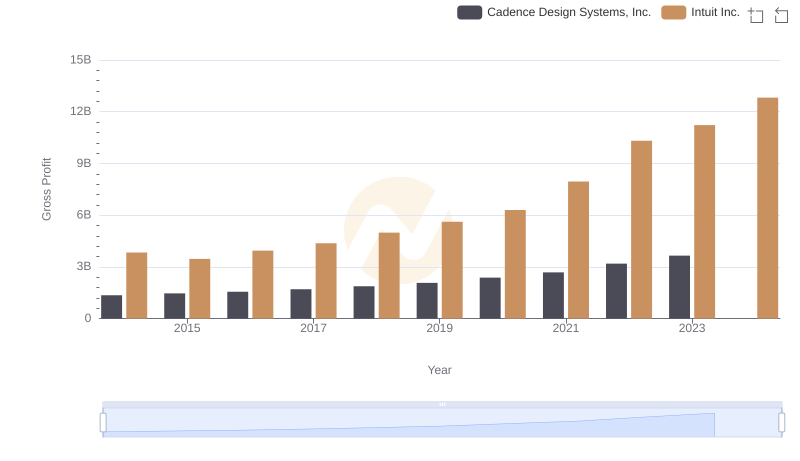
Key Insights on Gross Profit: Intuit Inc. vs Cadence Design Systems, Inc.
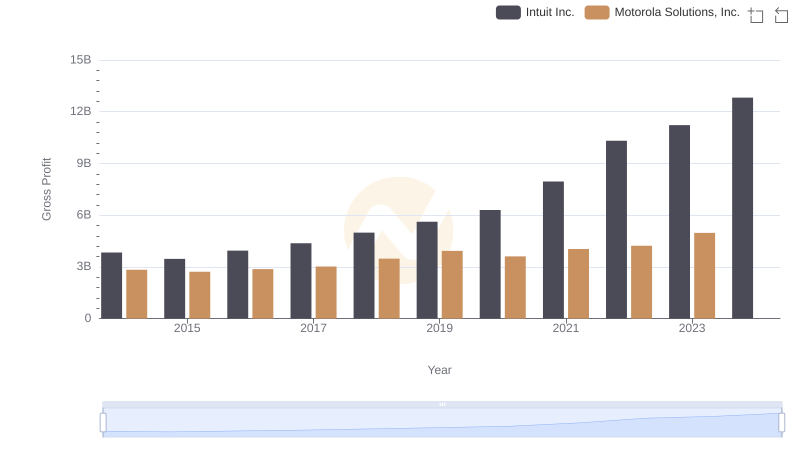
Intuit Inc. and Motorola Solutions, Inc.: A Detailed Gross Profit Analysis
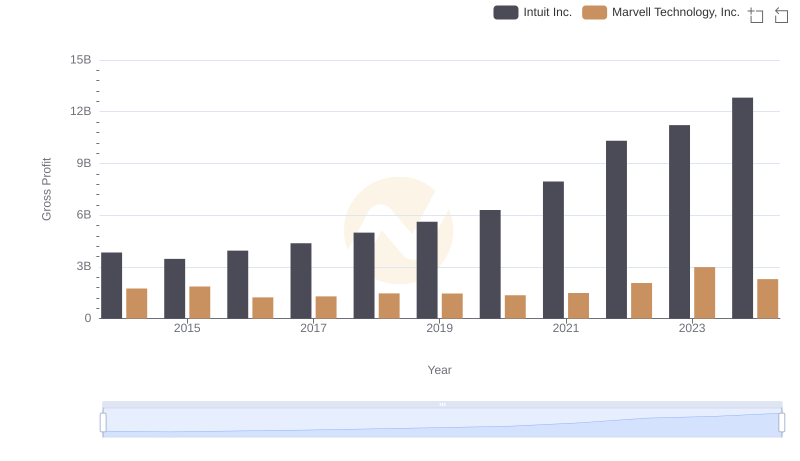
Gross Profit Analysis: Comparing Intuit Inc. and Marvell Technology, Inc.
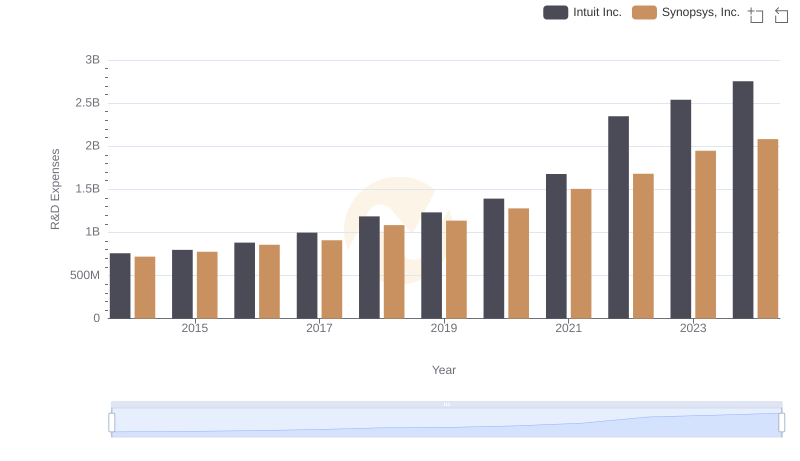
R&D Insights: How Intuit Inc. and Synopsys, Inc. Allocate Funds
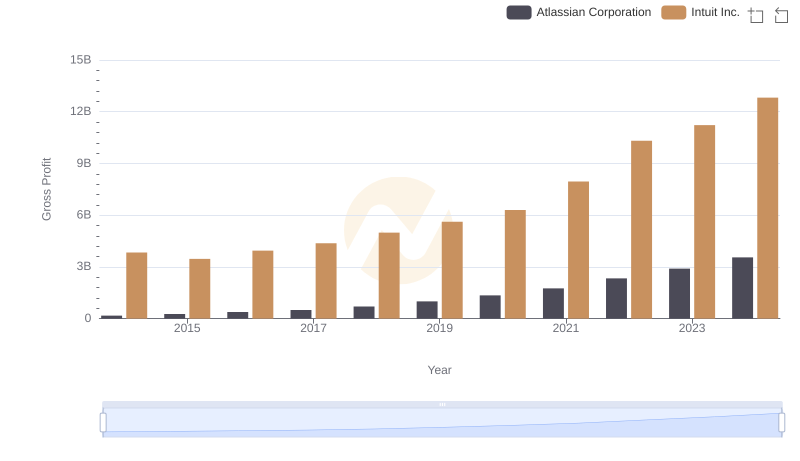
Gross Profit Analysis: Comparing Intuit Inc. and Atlassian Corporation
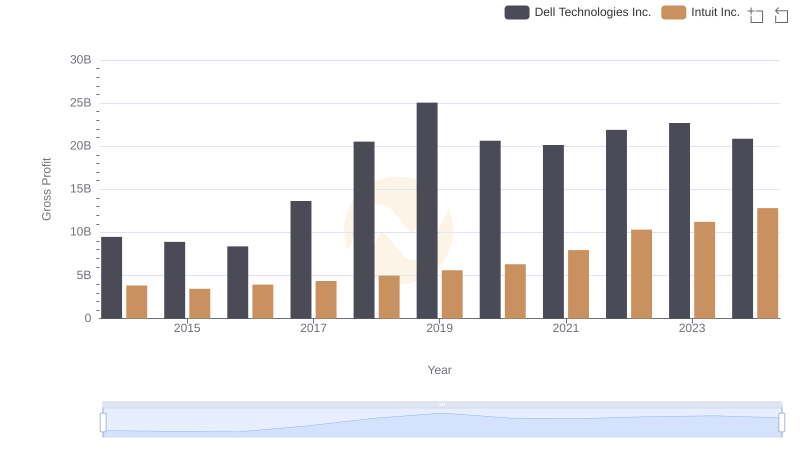
Intuit Inc. and Dell Technologies Inc.: A Detailed Gross Profit Analysis
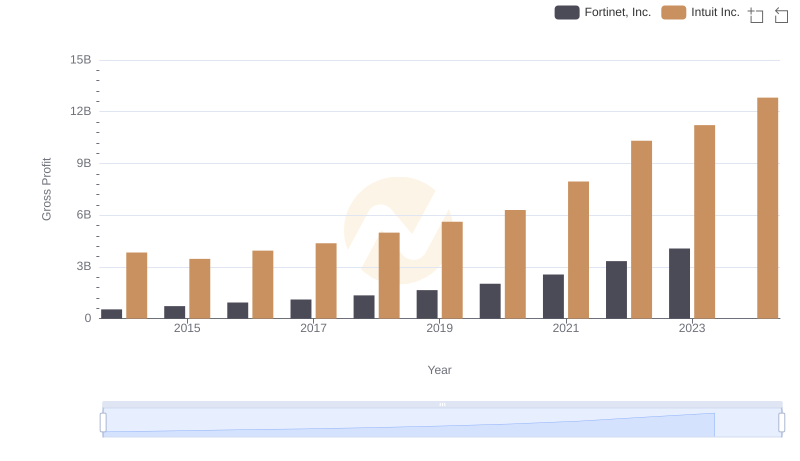
Intuit Inc. vs Fortinet, Inc.: A Gross Profit Performance Breakdown
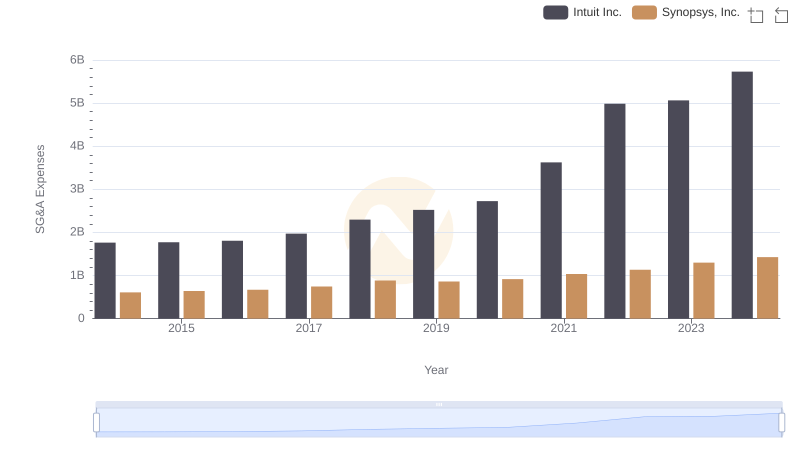
Who Optimizes SG&A Costs Better? Intuit Inc. or Synopsys, Inc.
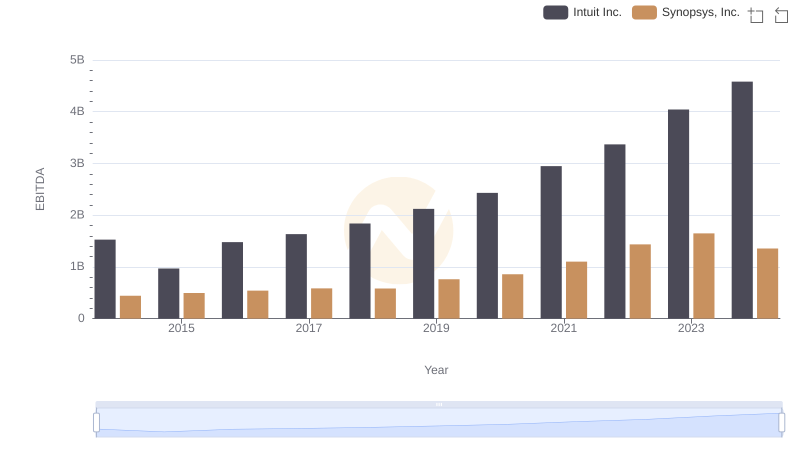
EBITDA Analysis: Evaluating Intuit Inc. Against Synopsys, Inc.