| __timestamp | EMCOR Group, Inc. | TFI International Inc. |
|---|---|---|
| Wednesday, January 1, 2014 | 355858000 | 334908602 |
| Thursday, January 1, 2015 | 362095000 | 314924803 |
| Friday, January 1, 2016 | 395913000 | 325584405 |
| Sunday, January 1, 2017 | 478459000 | 517899005 |
| Monday, January 1, 2018 | 489954000 | 521265317 |
| Tuesday, January 1, 2019 | 556055000 | 674440000 |
| Wednesday, January 1, 2020 | 601449000 | 709296000 |
| Friday, January 1, 2021 | 646861000 | 1358717000 |
| Saturday, January 1, 2022 | 682399000 | 1561728000 |
| Sunday, January 1, 2023 | 1009017000 | 1194213000 |
Unleashing insights
In the competitive landscape of North American industrial services and logistics, EMCOR Group, Inc. and TFI International Inc. have demonstrated remarkable EBITDA growth over the past decade. From 2014 to 2023, EMCOR's EBITDA surged by approximately 183%, while TFI International's EBITDA skyrocketed by an impressive 256%. This growth trajectory highlights the resilience and strategic prowess of both companies in navigating economic fluctuations and market demands.
This analysis underscores the dynamic nature of the industrial and logistics sectors, where strategic investments and market adaptability are key to sustained growth.
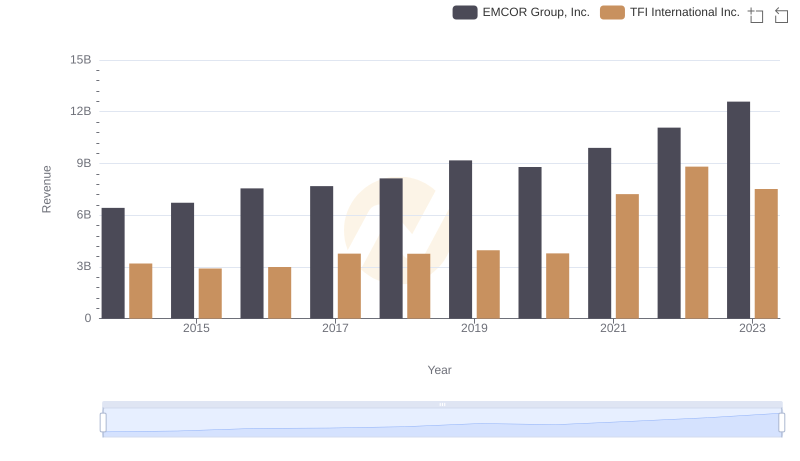
Comparing Revenue Performance: EMCOR Group, Inc. or TFI International Inc.?
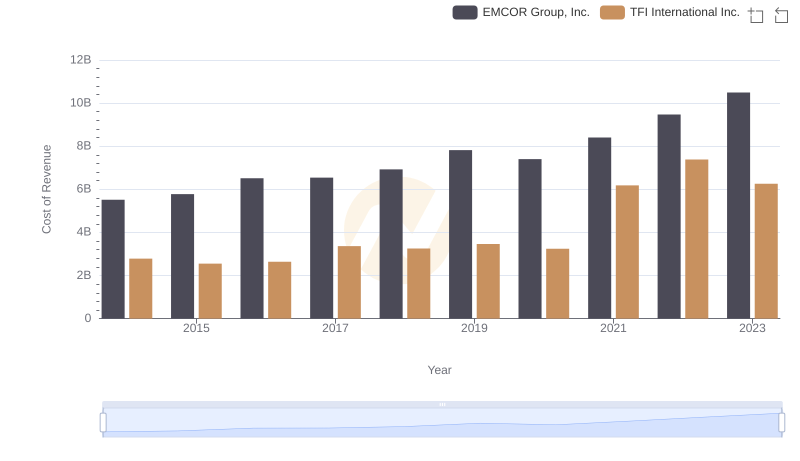
EMCOR Group, Inc. vs TFI International Inc.: Efficiency in Cost of Revenue Explored
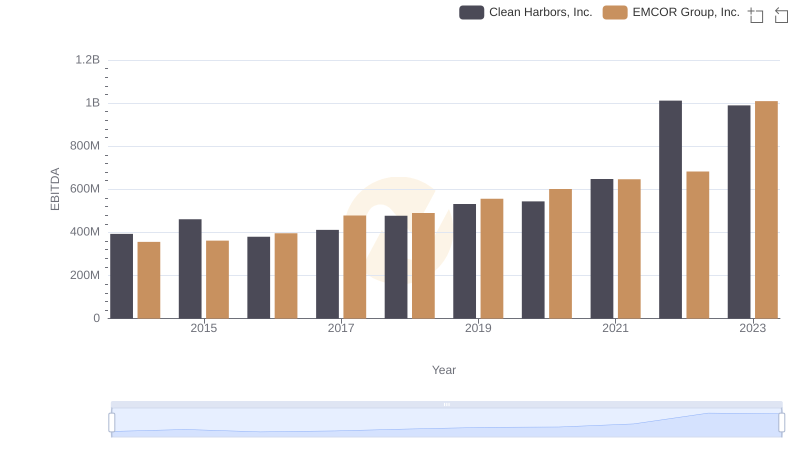
EBITDA Metrics Evaluated: EMCOR Group, Inc. vs Clean Harbors, Inc.
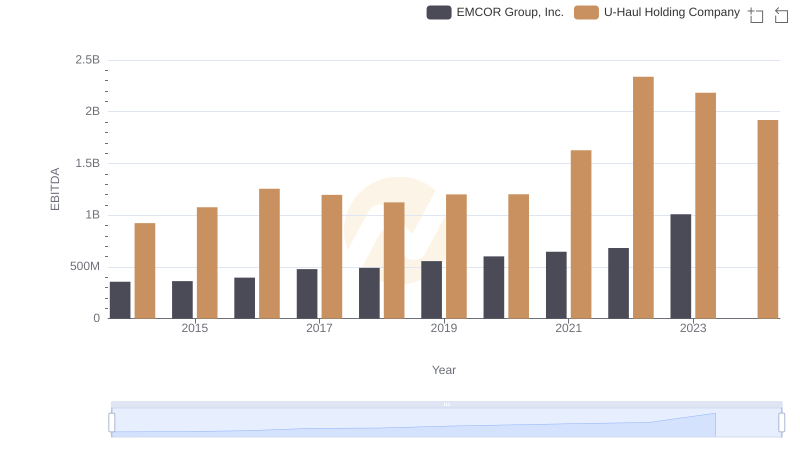
Professional EBITDA Benchmarking: EMCOR Group, Inc. vs U-Haul Holding Company
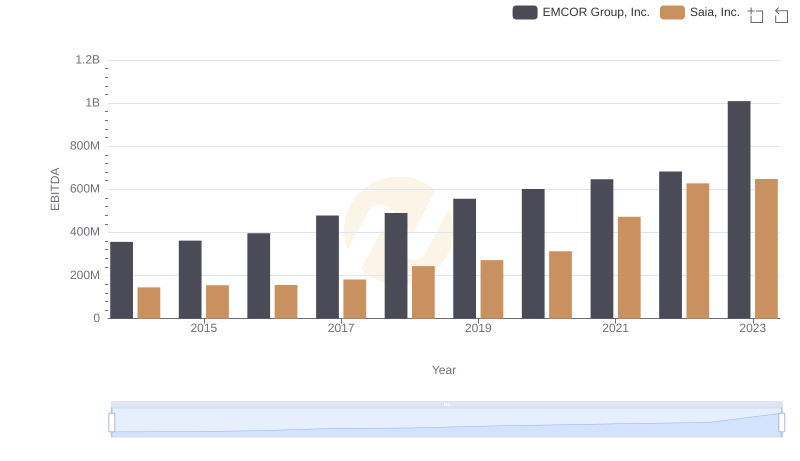
A Side-by-Side Analysis of EBITDA: EMCOR Group, Inc. and Saia, Inc.
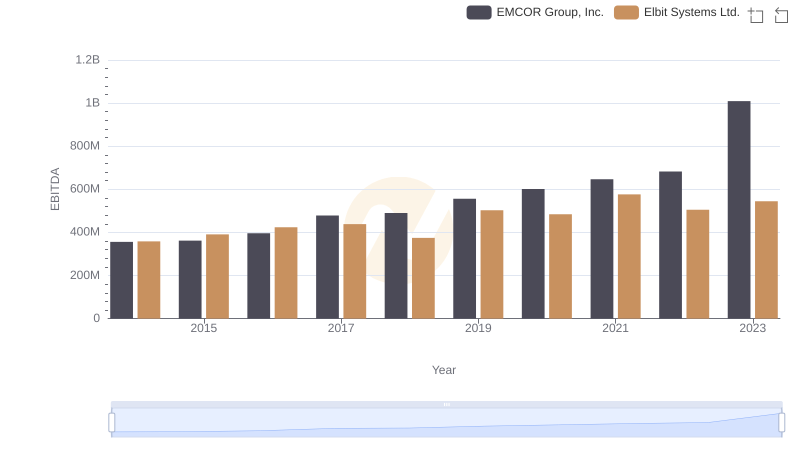
Professional EBITDA Benchmarking: EMCOR Group, Inc. vs Elbit Systems Ltd.
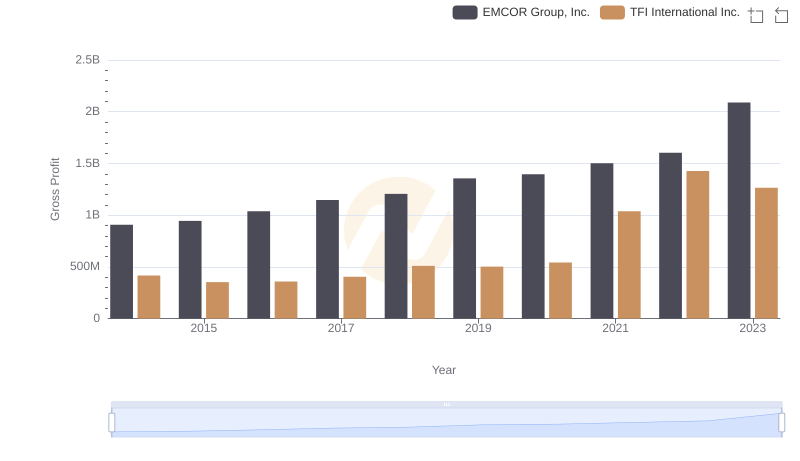
Gross Profit Analysis: Comparing EMCOR Group, Inc. and TFI International Inc.
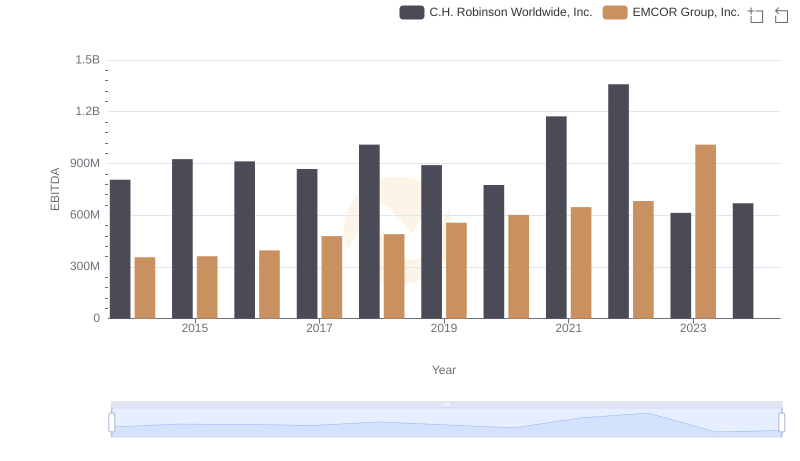
Comparative EBITDA Analysis: EMCOR Group, Inc. vs C.H. Robinson Worldwide, Inc.
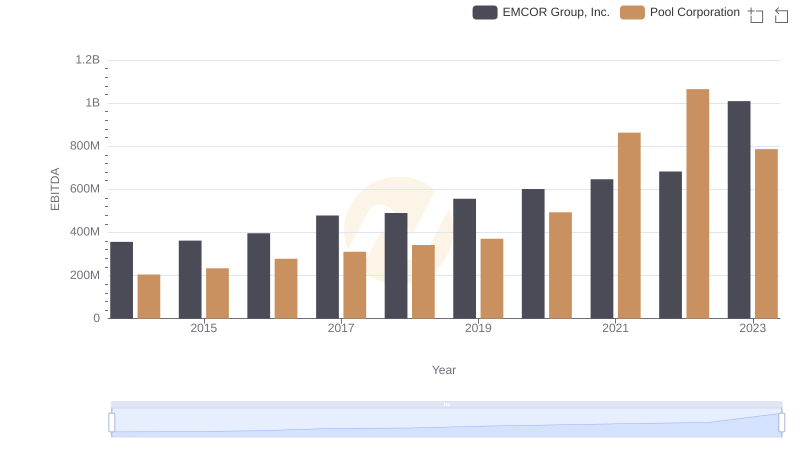
Professional EBITDA Benchmarking: EMCOR Group, Inc. vs Pool Corporation
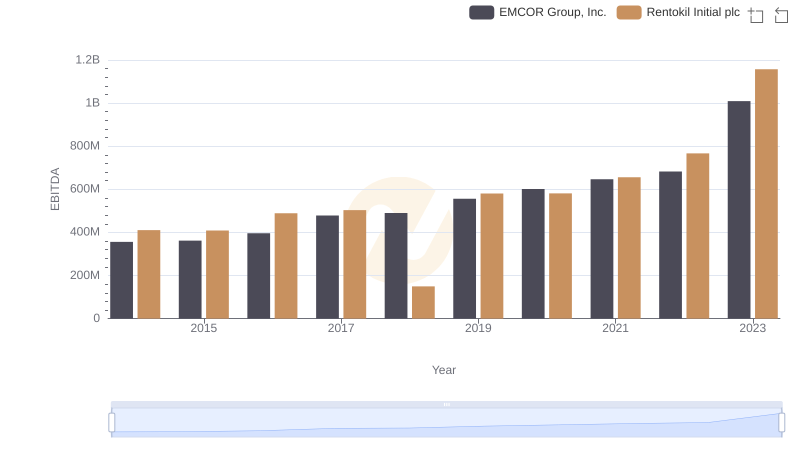
EBITDA Performance Review: EMCOR Group, Inc. vs Rentokil Initial plc
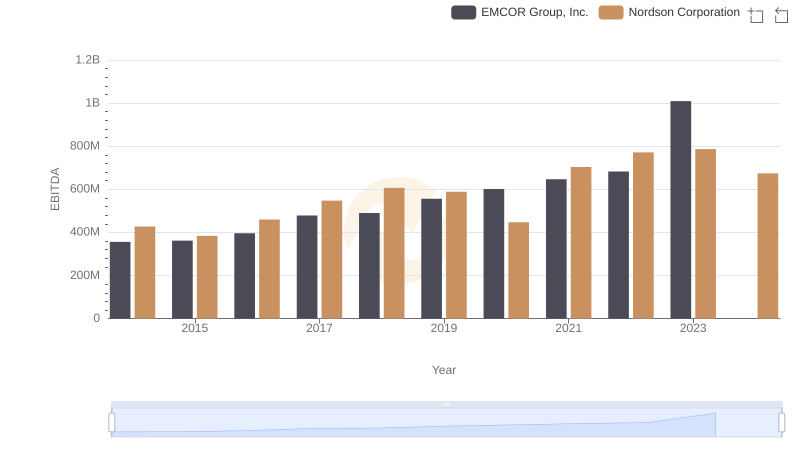
EBITDA Analysis: Evaluating EMCOR Group, Inc. Against Nordson Corporation
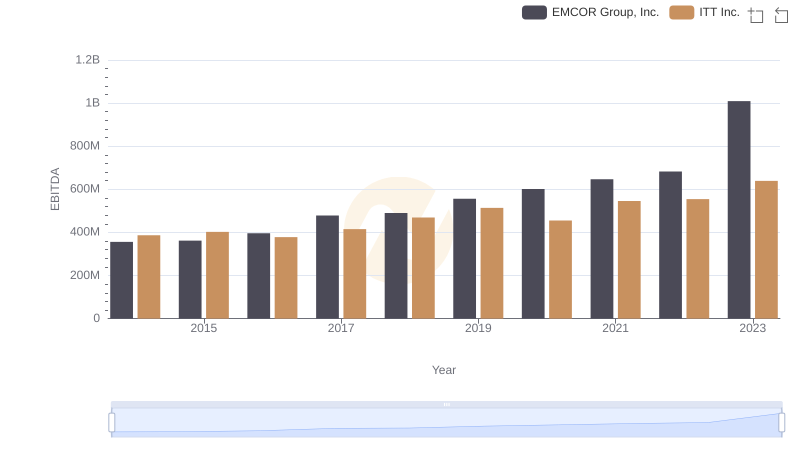
A Side-by-Side Analysis of EBITDA: EMCOR Group, Inc. and ITT Inc.