| __timestamp | EMCOR Group, Inc. | Nordson Corporation |
|---|---|---|
| Wednesday, January 1, 2014 | 355858000 | 427302000 |
| Thursday, January 1, 2015 | 362095000 | 384160000 |
| Friday, January 1, 2016 | 395913000 | 460120000 |
| Sunday, January 1, 2017 | 478459000 | 547746000 |
| Monday, January 1, 2018 | 489954000 | 606502000 |
| Tuesday, January 1, 2019 | 556055000 | 588493000 |
| Wednesday, January 1, 2020 | 601449000 | 446951000 |
| Friday, January 1, 2021 | 646861000 | 703550000 |
| Saturday, January 1, 2022 | 682399000 | 771615000 |
| Sunday, January 1, 2023 | 1009017000 | 786742000 |
| Monday, January 1, 2024 | 674001000 |
Infusing magic into the data realm
In the competitive landscape of industrial services and manufacturing, EMCOR Group, Inc. and Nordson Corporation have showcased remarkable EBITDA growth over the past decade. From 2014 to 2023, EMCOR's EBITDA surged by approximately 183%, peaking at over $1 billion in 2023. This growth trajectory highlights EMCOR's strategic prowess in expanding its market footprint and operational efficiency.
Conversely, Nordson Corporation, a leader in precision technology, experienced a steady EBITDA increase of about 84% during the same period, reaching nearly $787 million in 2023. Despite a dip in 2020, Nordson's resilience is evident in its recovery and subsequent growth.
While EMCOR's 2023 figures are impressive, Nordson's consistent performance underscores its robust business model. However, the absence of EMCOR's 2024 data leaves room for speculation on its future trajectory. This analysis offers a compelling glimpse into the financial health and strategic direction of these industry giants.
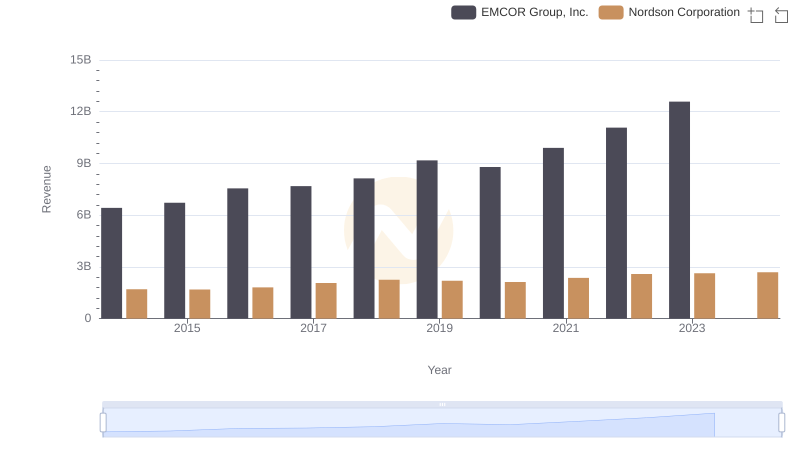
Who Generates More Revenue? EMCOR Group, Inc. or Nordson Corporation
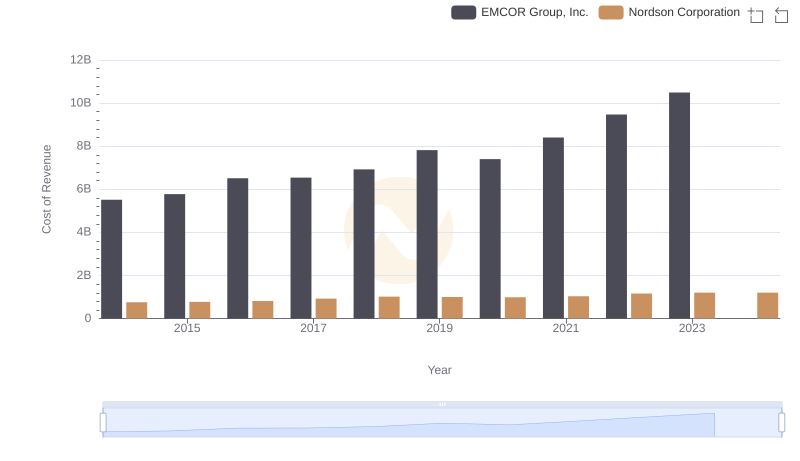
Cost of Revenue: Key Insights for EMCOR Group, Inc. and Nordson Corporation
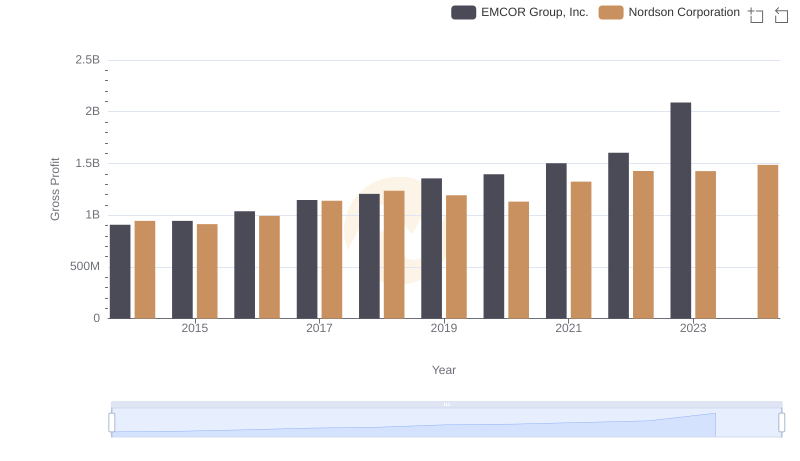
Key Insights on Gross Profit: EMCOR Group, Inc. vs Nordson Corporation
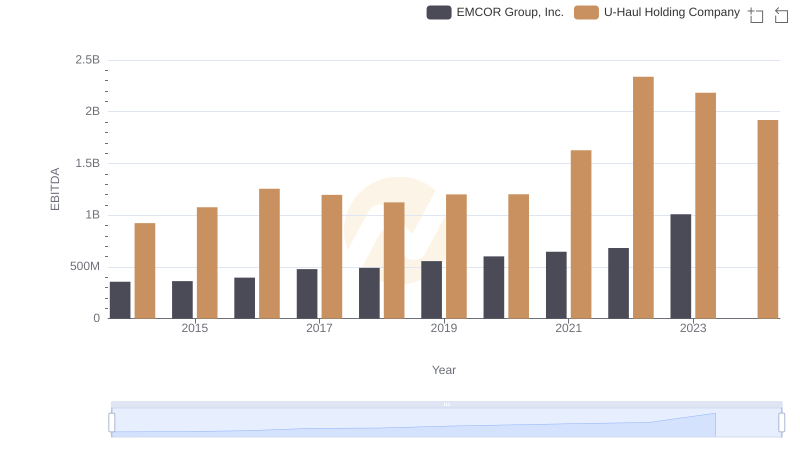
Professional EBITDA Benchmarking: EMCOR Group, Inc. vs U-Haul Holding Company
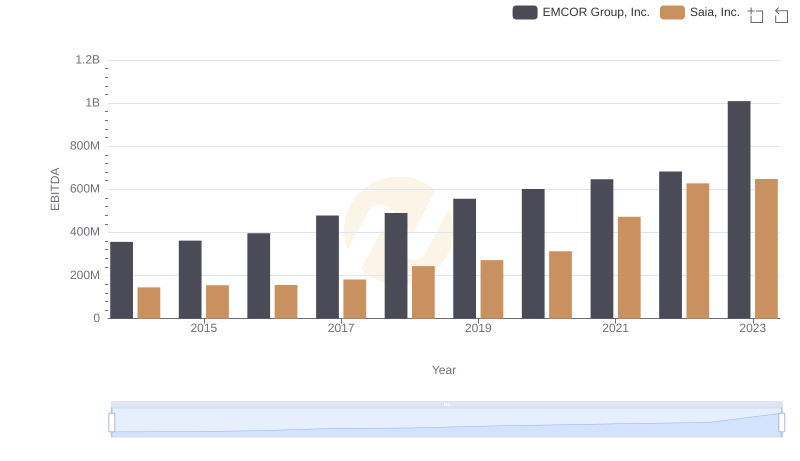
A Side-by-Side Analysis of EBITDA: EMCOR Group, Inc. and Saia, Inc.
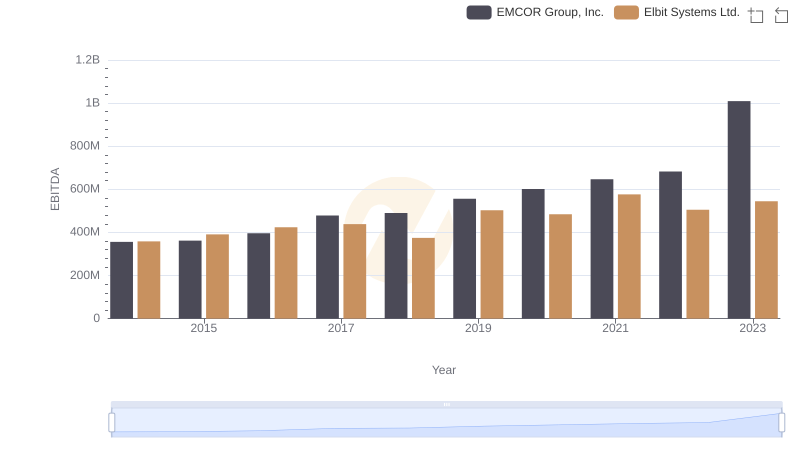
Professional EBITDA Benchmarking: EMCOR Group, Inc. vs Elbit Systems Ltd.
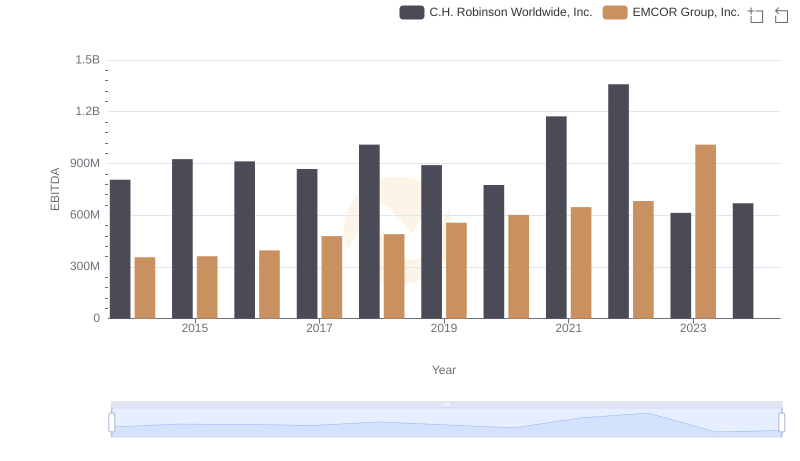
Comparative EBITDA Analysis: EMCOR Group, Inc. vs C.H. Robinson Worldwide, Inc.
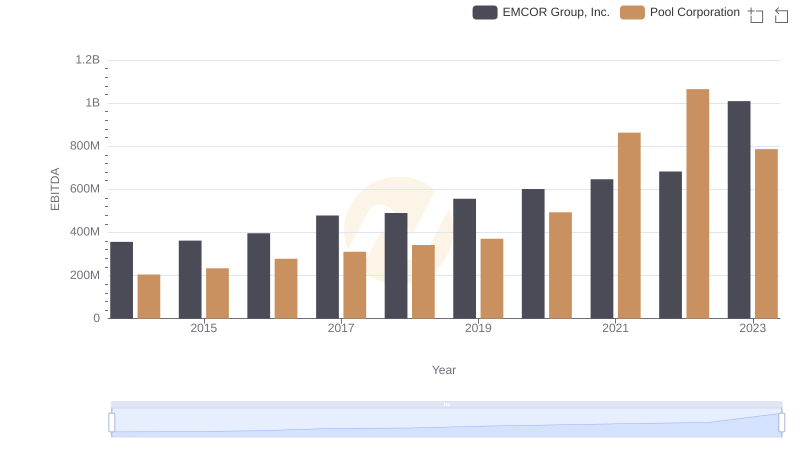
Professional EBITDA Benchmarking: EMCOR Group, Inc. vs Pool Corporation
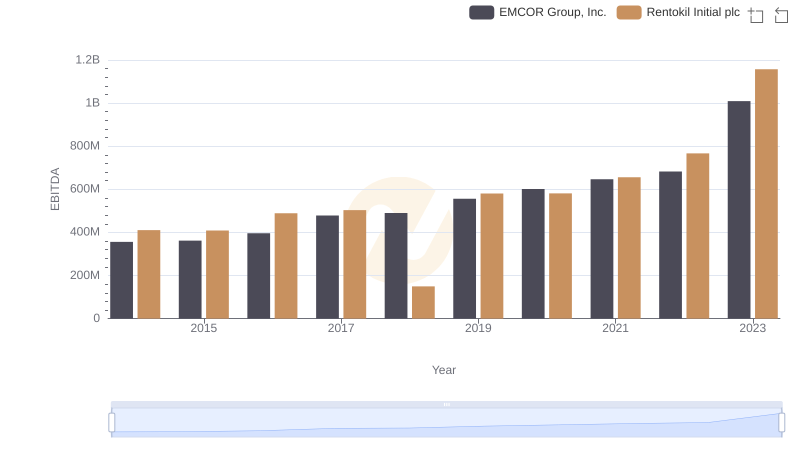
EBITDA Performance Review: EMCOR Group, Inc. vs Rentokil Initial plc
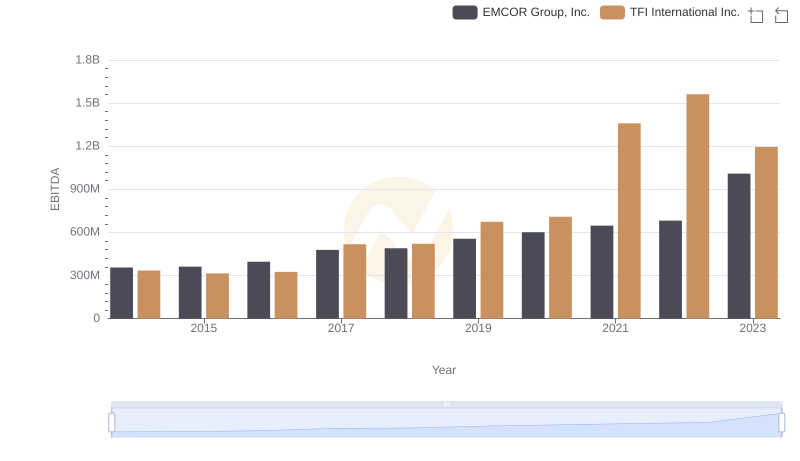
EMCOR Group, Inc. vs TFI International Inc.: In-Depth EBITDA Performance Comparison
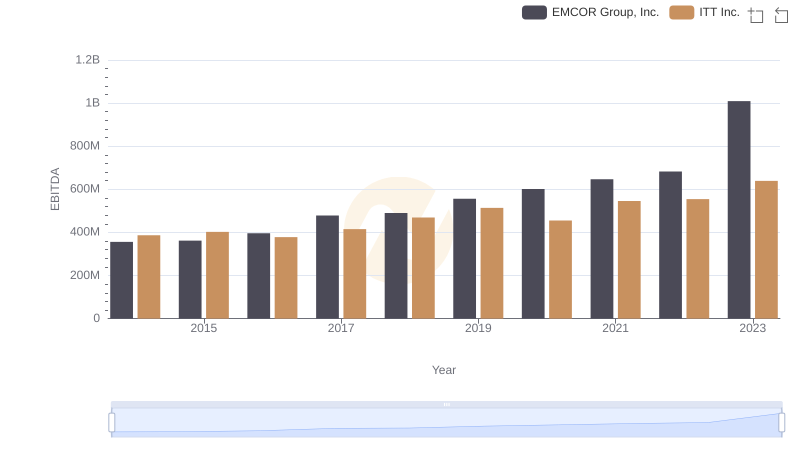
A Side-by-Side Analysis of EBITDA: EMCOR Group, Inc. and ITT Inc.