| __timestamp | EMCOR Group, Inc. | TFI International Inc. |
|---|---|---|
| Wednesday, January 1, 2014 | 6424965000 | 3199928501 |
| Thursday, January 1, 2015 | 6718726000 | 2904026835 |
| Friday, January 1, 2016 | 7551524000 | 2994723606 |
| Sunday, January 1, 2017 | 7686999000 | 3770194035 |
| Monday, January 1, 2018 | 8130631000 | 3761450188 |
| Tuesday, January 1, 2019 | 9174611000 | 3964619871 |
| Wednesday, January 1, 2020 | 8797061000 | 3781134000 |
| Friday, January 1, 2021 | 9903580000 | 7220429000 |
| Saturday, January 1, 2022 | 11076120000 | 8812491000 |
| Sunday, January 1, 2023 | 12582873000 | 7521167000 |
Unleashing insights
In the ever-evolving landscape of industrial services and logistics, EMCOR Group, Inc. and TFI International Inc. have emerged as formidable players. Over the past decade, EMCOR has consistently outperformed TFI in terms of revenue, showcasing a robust growth trajectory. From 2014 to 2023, EMCOR's revenue surged by nearly 96%, peaking at approximately $12.6 billion in 2023. In contrast, TFI International experienced a commendable 135% increase, reaching around $7.5 billion in the same year.
These trends highlight the dynamic nature of the industry and the strategic maneuvers by these companies to capture market share.
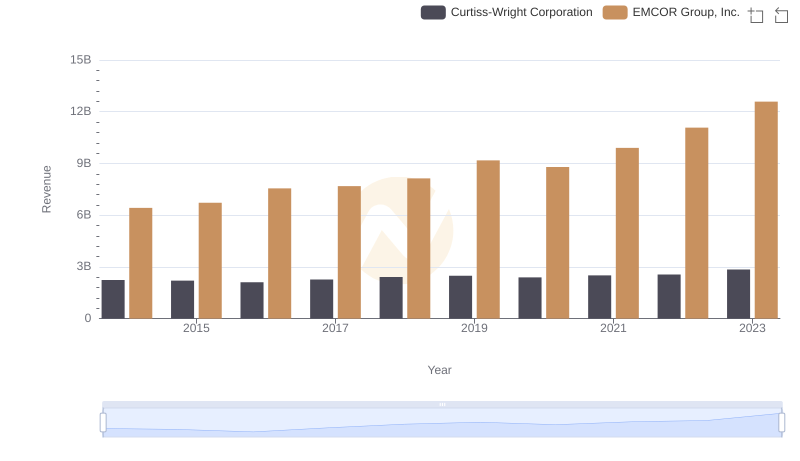
Comparing Revenue Performance: EMCOR Group, Inc. or Curtiss-Wright Corporation?
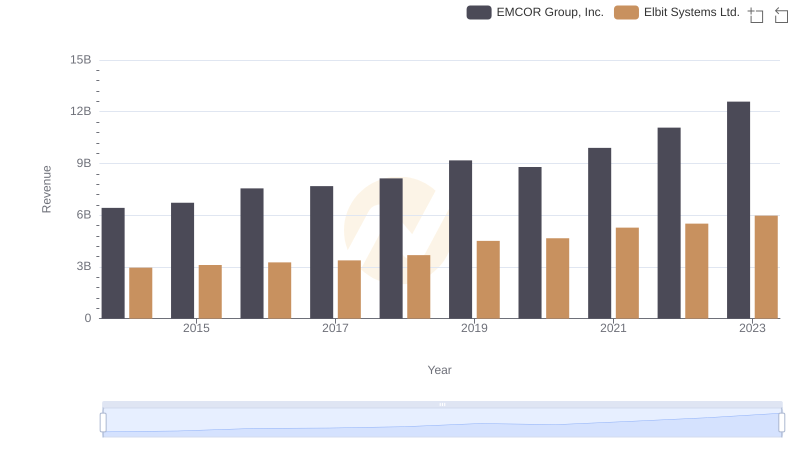
Comparing Revenue Performance: EMCOR Group, Inc. or Elbit Systems Ltd.?
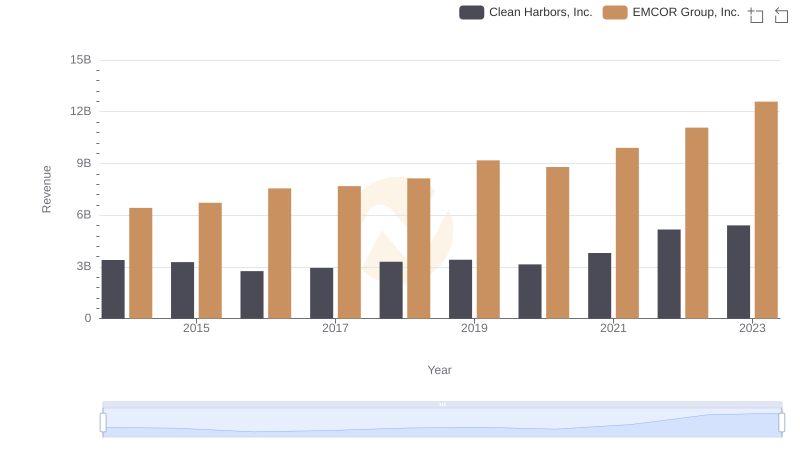
Breaking Down Revenue Trends: EMCOR Group, Inc. vs Clean Harbors, Inc.
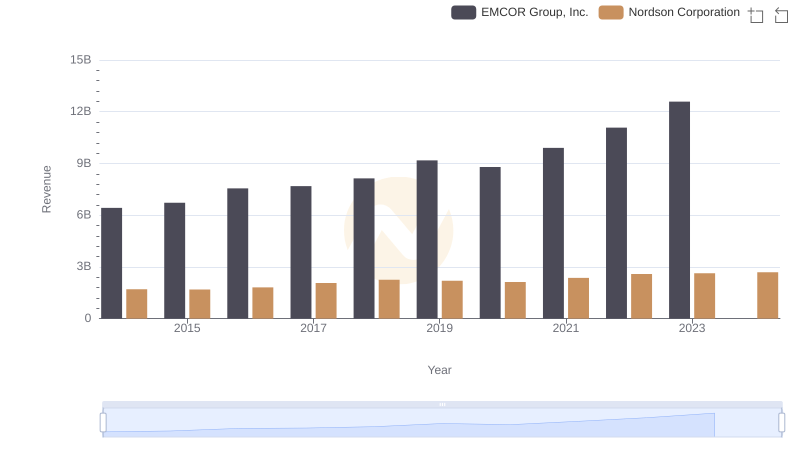
Who Generates More Revenue? EMCOR Group, Inc. or Nordson Corporation
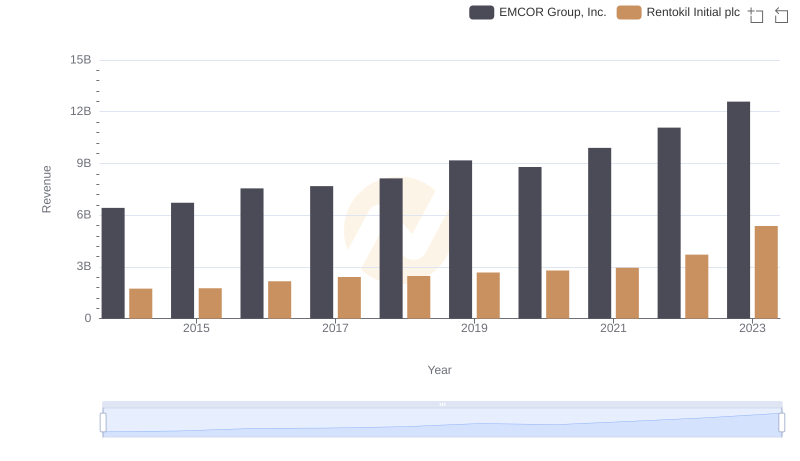
Who Generates More Revenue? EMCOR Group, Inc. or Rentokil Initial plc
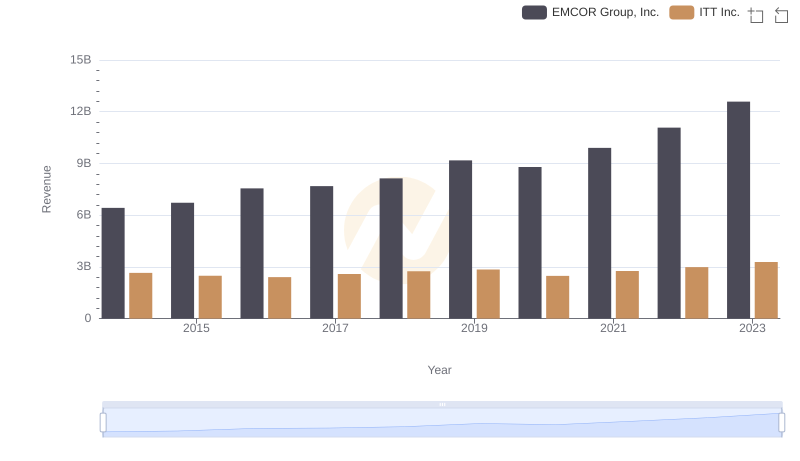
EMCOR Group, Inc. vs ITT Inc.: Annual Revenue Growth Compared
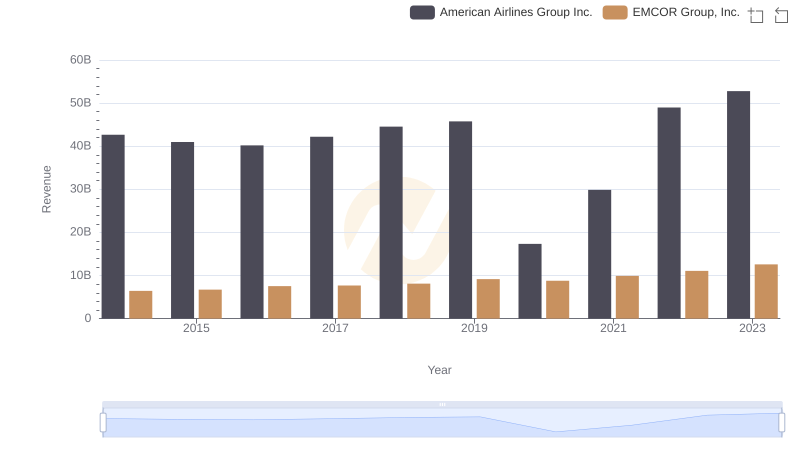
EMCOR Group, Inc. vs American Airlines Group Inc.: Examining Key Revenue Metrics
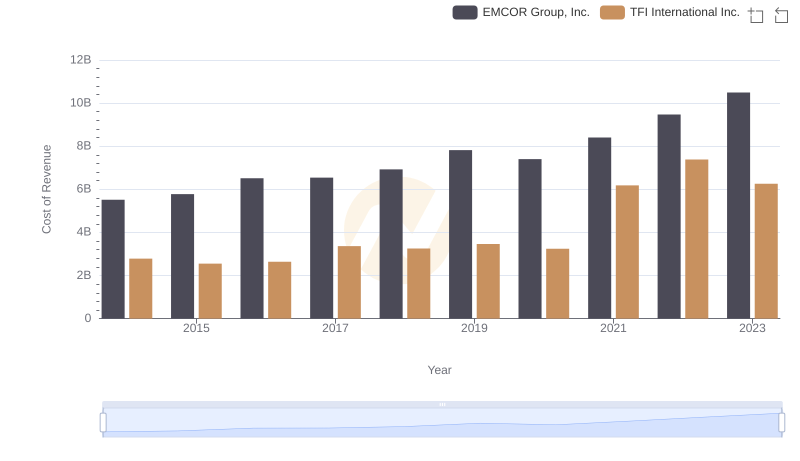
EMCOR Group, Inc. vs TFI International Inc.: Efficiency in Cost of Revenue Explored
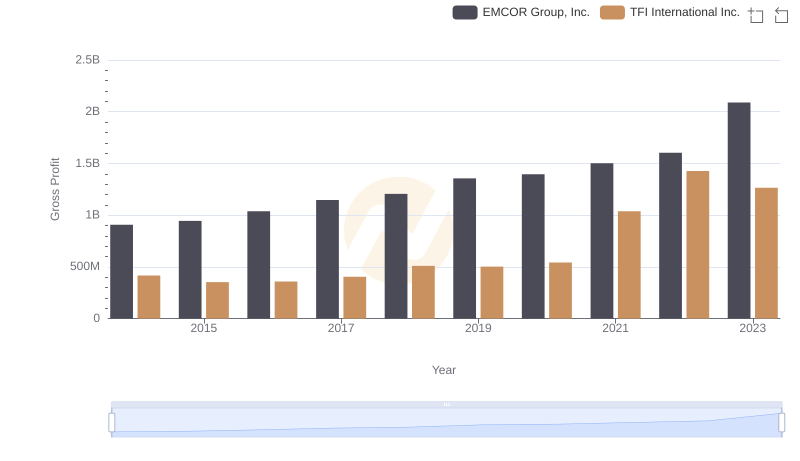
Gross Profit Analysis: Comparing EMCOR Group, Inc. and TFI International Inc.
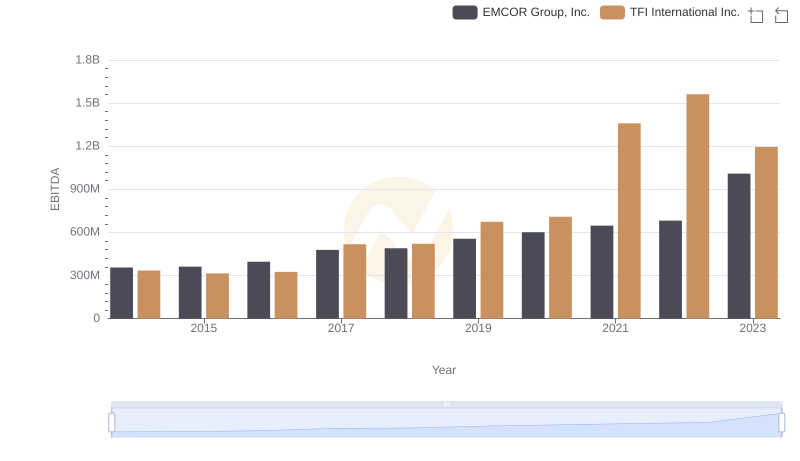
EMCOR Group, Inc. vs TFI International Inc.: In-Depth EBITDA Performance Comparison