| __timestamp | EMCOR Group, Inc. | ITT Inc. |
|---|---|---|
| Wednesday, January 1, 2014 | 355858000 | 386700000 |
| Thursday, January 1, 2015 | 362095000 | 402700000 |
| Friday, January 1, 2016 | 395913000 | 378000000 |
| Sunday, January 1, 2017 | 478459000 | 415000000 |
| Monday, January 1, 2018 | 489954000 | 469000000 |
| Tuesday, January 1, 2019 | 556055000 | 513900000 |
| Wednesday, January 1, 2020 | 601449000 | 455000000 |
| Friday, January 1, 2021 | 646861000 | 545600000 |
| Saturday, January 1, 2022 | 682399000 | 554500000 |
| Sunday, January 1, 2023 | 1009017000 | 639100000 |
| Monday, January 1, 2024 | 821500000 |
Data in motion
In the ever-evolving landscape of industrial services and manufacturing, EMCOR Group, Inc. and ITT Inc. have demonstrated remarkable financial resilience over the past decade. From 2014 to 2023, EMCOR's EBITDA surged by approximately 183%, peaking in 2023 with a notable increase of 48% from the previous year. Meanwhile, ITT Inc. experienced a steady growth of around 65% during the same period, showcasing its robust operational strategies.
This side-by-side analysis highlights the dynamic nature of the industrial sector, where strategic foresight and adaptability are key to financial success.
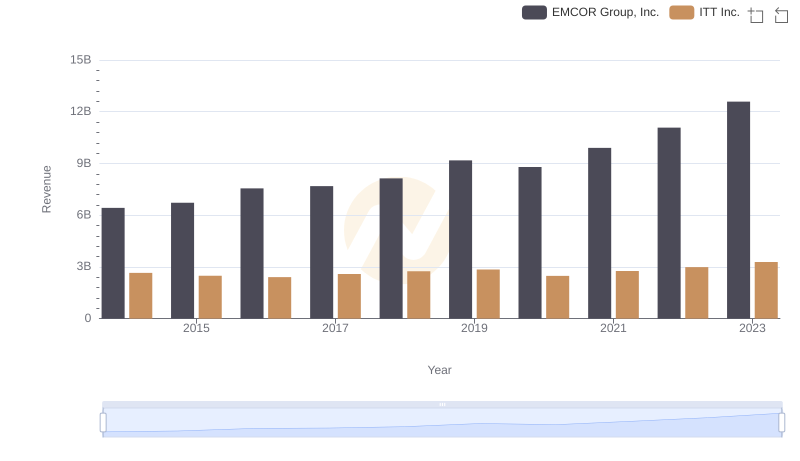
EMCOR Group, Inc. vs ITT Inc.: Annual Revenue Growth Compared
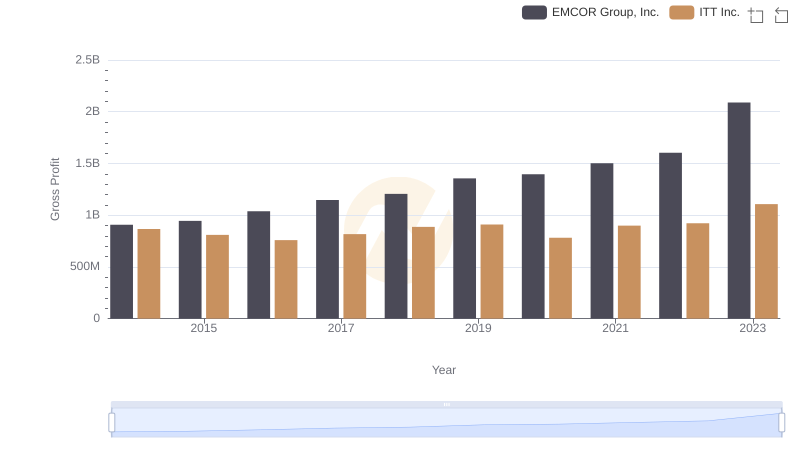
Who Generates Higher Gross Profit? EMCOR Group, Inc. or ITT Inc.
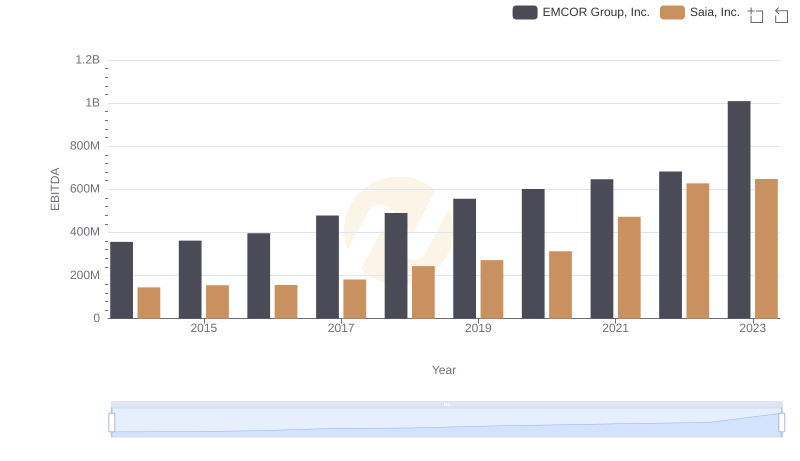
A Side-by-Side Analysis of EBITDA: EMCOR Group, Inc. and Saia, Inc.
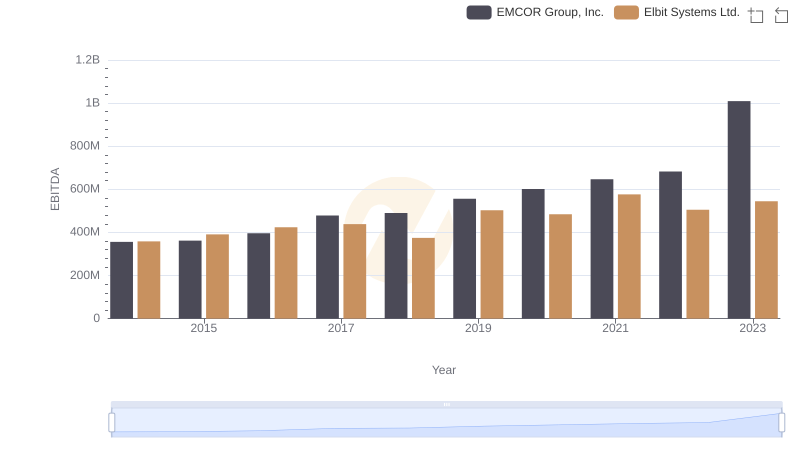
Professional EBITDA Benchmarking: EMCOR Group, Inc. vs Elbit Systems Ltd.
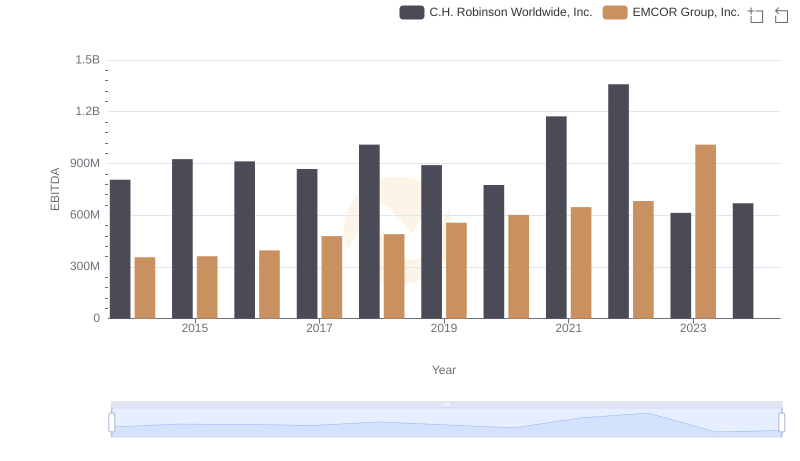
Comparative EBITDA Analysis: EMCOR Group, Inc. vs C.H. Robinson Worldwide, Inc.
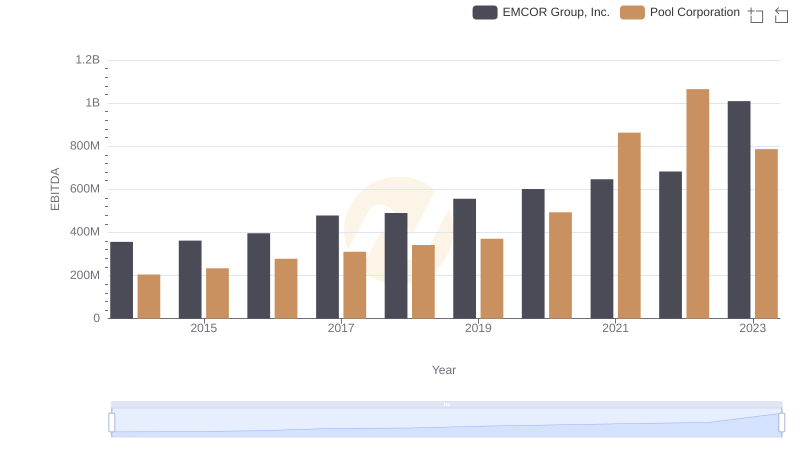
Professional EBITDA Benchmarking: EMCOR Group, Inc. vs Pool Corporation
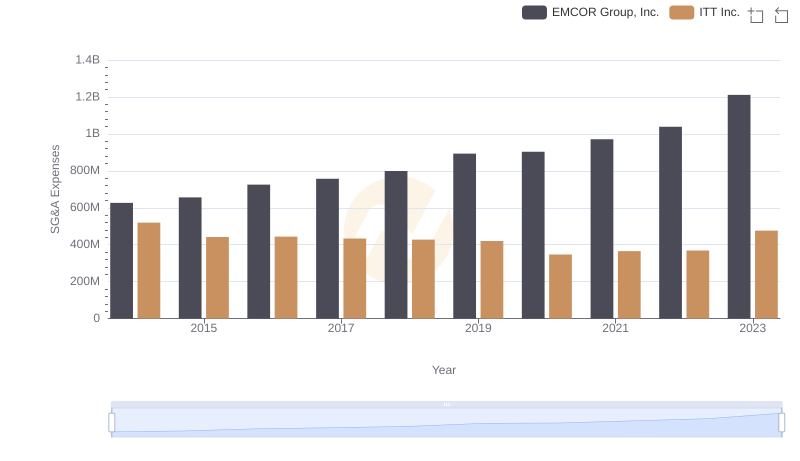
EMCOR Group, Inc. vs ITT Inc.: SG&A Expense Trends
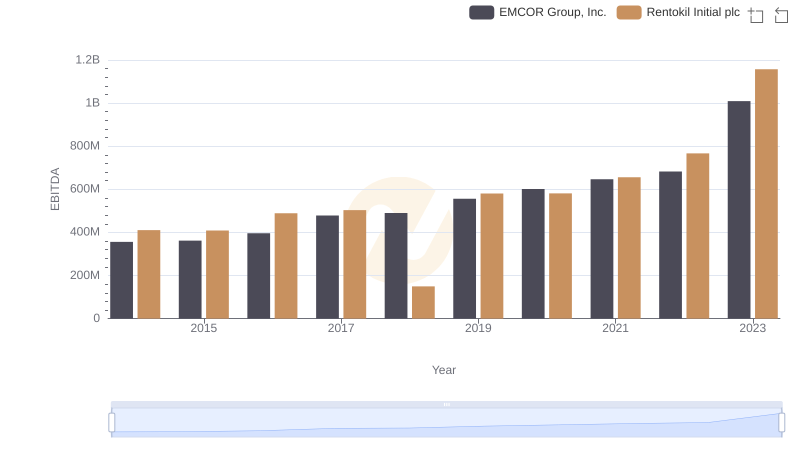
EBITDA Performance Review: EMCOR Group, Inc. vs Rentokil Initial plc
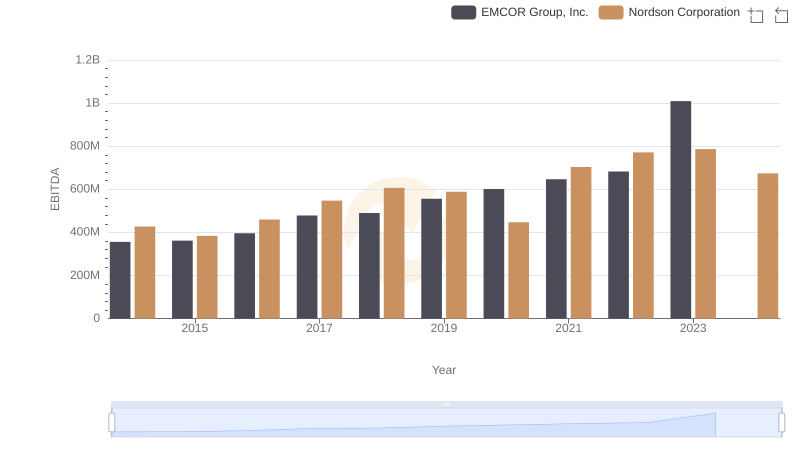
EBITDA Analysis: Evaluating EMCOR Group, Inc. Against Nordson Corporation
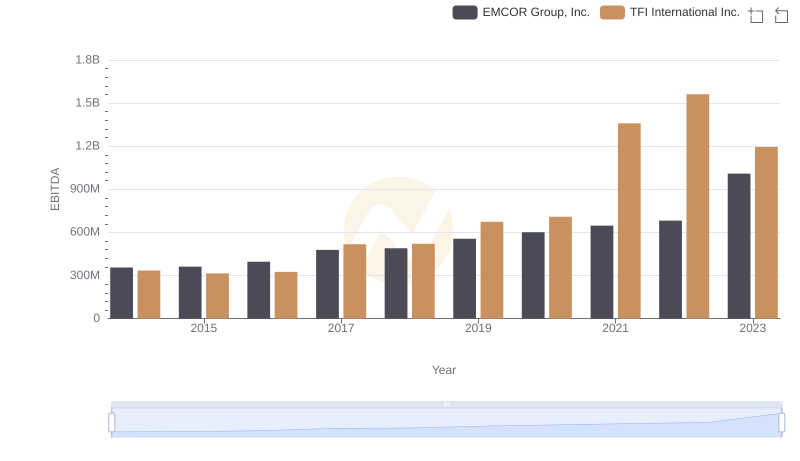
EMCOR Group, Inc. vs TFI International Inc.: In-Depth EBITDA Performance Comparison
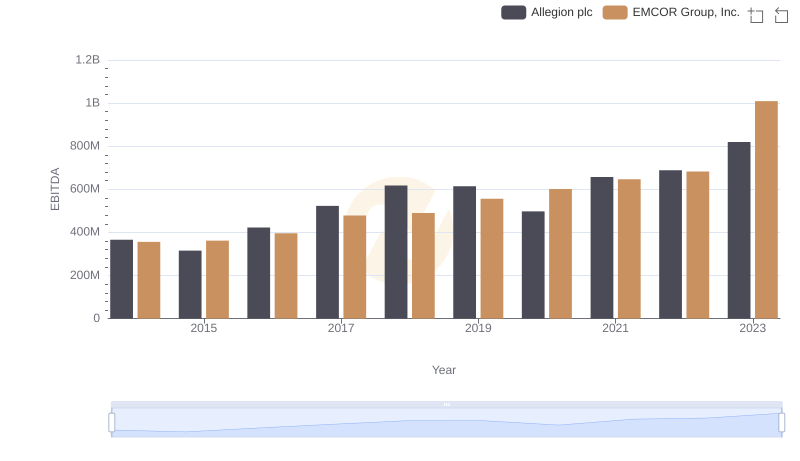
EMCOR Group, Inc. and Allegion plc: A Detailed Examination of EBITDA Performance