| __timestamp | EMCOR Group, Inc. | TFI International Inc. |
|---|---|---|
| Wednesday, January 1, 2014 | 5517719000 | 2782605137 |
| Thursday, January 1, 2015 | 5774247000 | 2551474032 |
| Friday, January 1, 2016 | 6513662000 | 2636493564 |
| Sunday, January 1, 2017 | 6539987000 | 3364979721 |
| Monday, January 1, 2018 | 6925178000 | 3251443800 |
| Tuesday, January 1, 2019 | 7818743000 | 3461987950 |
| Wednesday, January 1, 2020 | 7401679000 | 3239249000 |
| Friday, January 1, 2021 | 8401843000 | 6182566000 |
| Saturday, January 1, 2022 | 9472526000 | 7385640000 |
| Sunday, January 1, 2023 | 10493534000 | 6255775000 |
Data in motion
In the competitive landscape of industrial services and logistics, cost efficiency is paramount. Over the past decade, EMCOR Group, Inc. and TFI International Inc. have demonstrated distinct trajectories in managing their cost of revenue. From 2014 to 2023, EMCOR's cost of revenue surged by approximately 90%, reflecting its expansive growth strategy. In contrast, TFI International's cost of revenue increased by about 125%, indicating a robust expansion in its logistics operations.
This analysis underscores the dynamic strategies employed by these industry leaders in optimizing their operational costs.
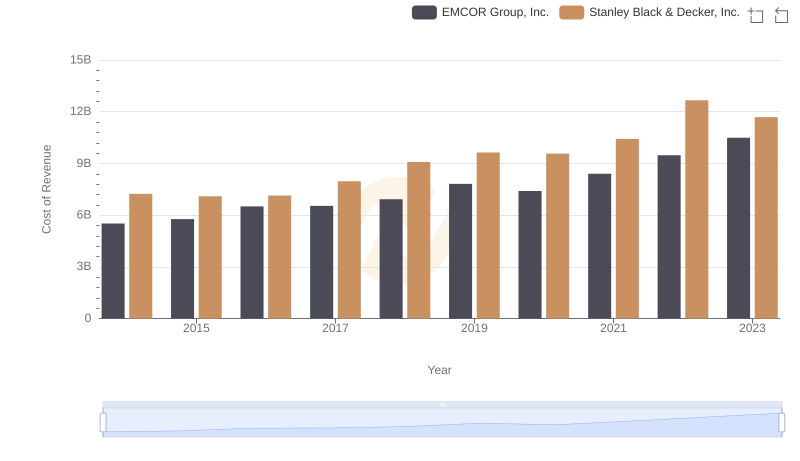
Cost of Revenue: Key Insights for EMCOR Group, Inc. and Stanley Black & Decker, Inc.
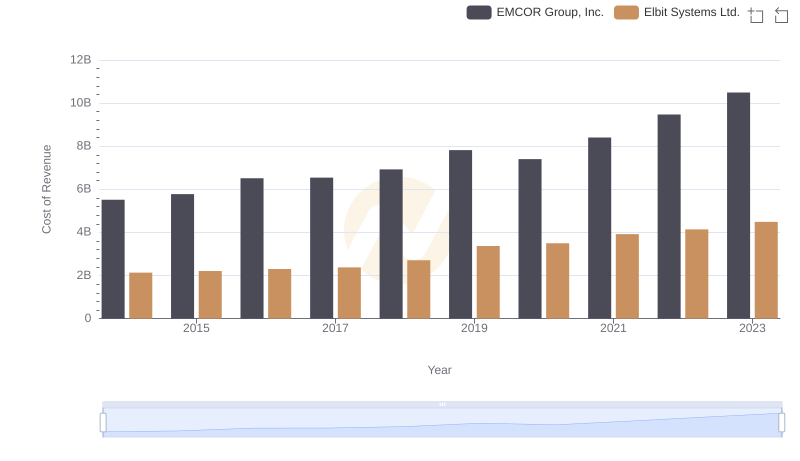
Cost of Revenue Trends: EMCOR Group, Inc. vs Elbit Systems Ltd.
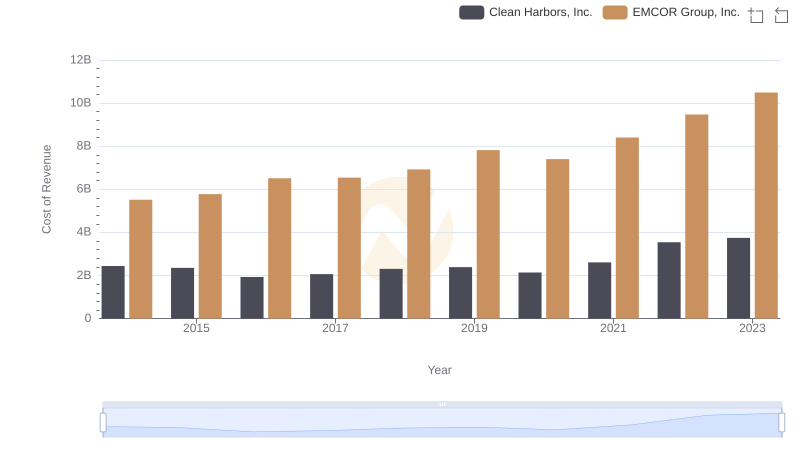
Cost of Revenue Trends: EMCOR Group, Inc. vs Clean Harbors, Inc.
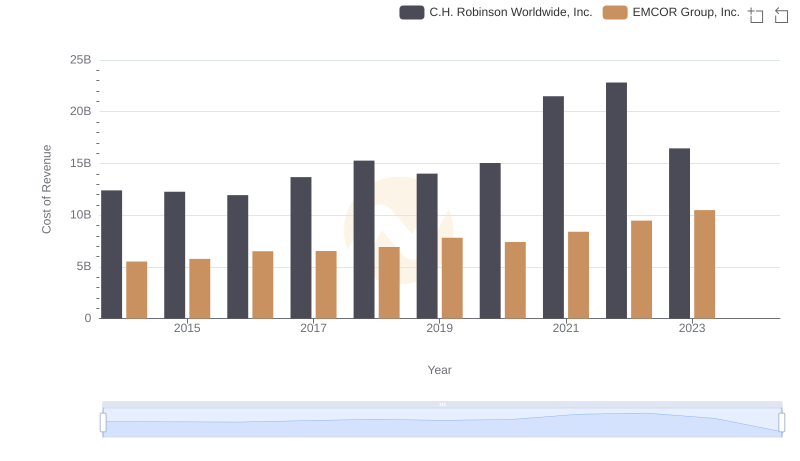
Cost of Revenue Comparison: EMCOR Group, Inc. vs C.H. Robinson Worldwide, Inc.
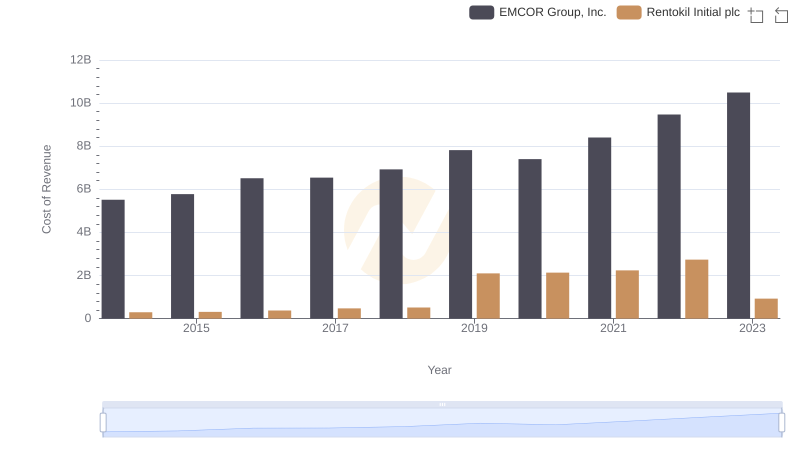
Analyzing Cost of Revenue: EMCOR Group, Inc. and Rentokil Initial plc
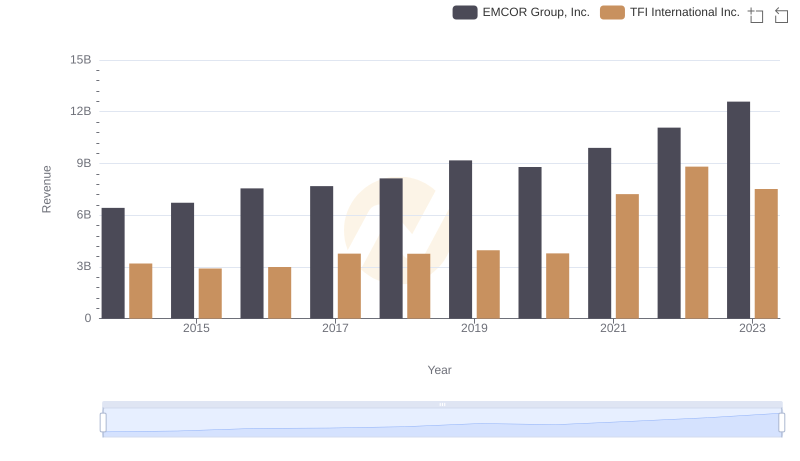
Comparing Revenue Performance: EMCOR Group, Inc. or TFI International Inc.?
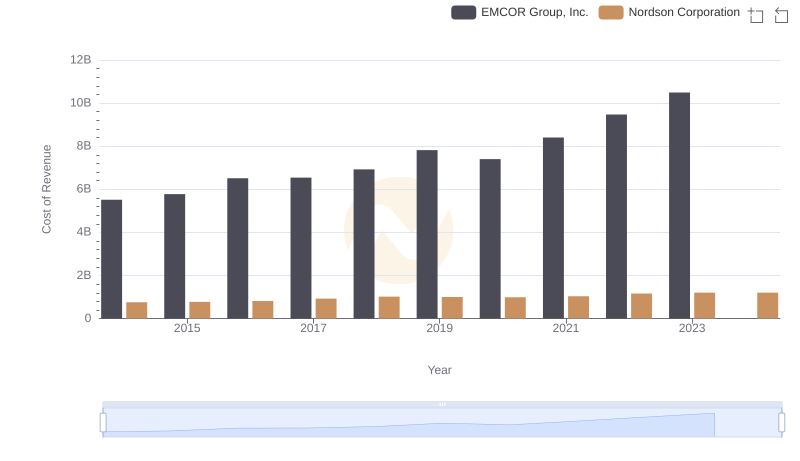
Cost of Revenue: Key Insights for EMCOR Group, Inc. and Nordson Corporation
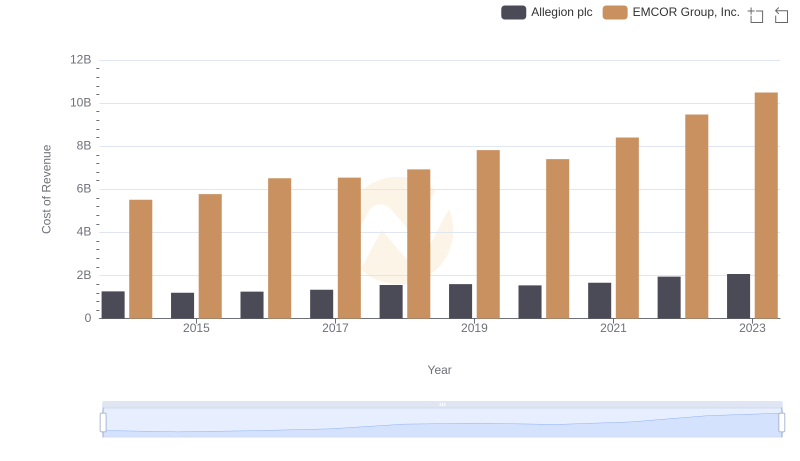
Cost Insights: Breaking Down EMCOR Group, Inc. and Allegion plc's Expenses
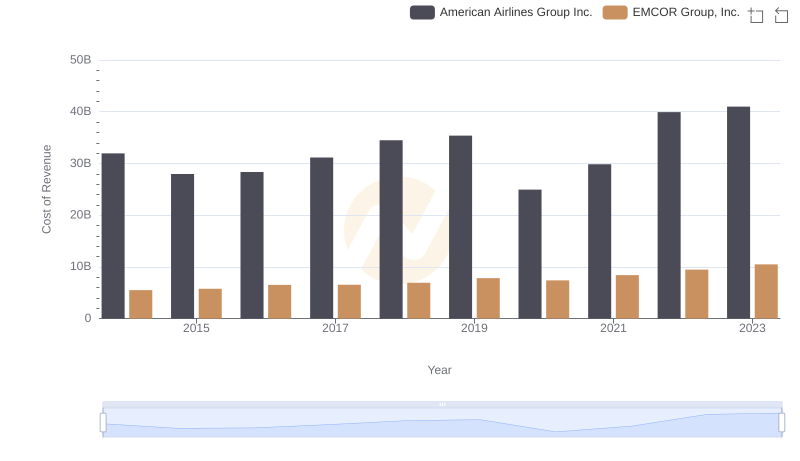
Cost of Revenue: Key Insights for EMCOR Group, Inc. and American Airlines Group Inc.
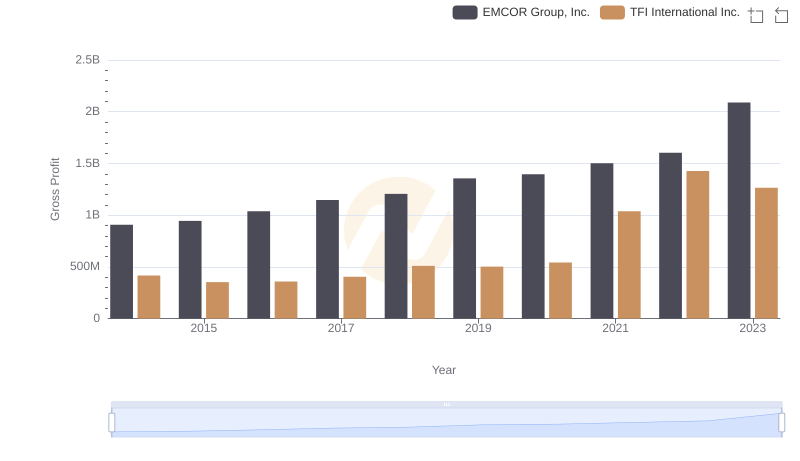
Gross Profit Analysis: Comparing EMCOR Group, Inc. and TFI International Inc.
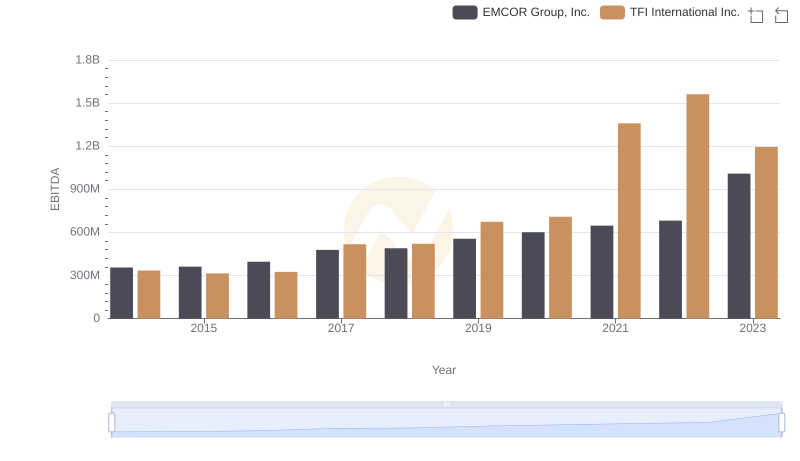
EMCOR Group, Inc. vs TFI International Inc.: In-Depth EBITDA Performance Comparison