| __timestamp | EMCOR Group, Inc. | TFI International Inc. |
|---|---|---|
| Wednesday, January 1, 2014 | 907246000 | 417323364 |
| Thursday, January 1, 2015 | 944479000 | 352552803 |
| Friday, January 1, 2016 | 1037862000 | 358230042 |
| Sunday, January 1, 2017 | 1147012000 | 405214314 |
| Monday, January 1, 2018 | 1205453000 | 510006388 |
| Tuesday, January 1, 2019 | 1355868000 | 502631921 |
| Wednesday, January 1, 2020 | 1395382000 | 541885000 |
| Friday, January 1, 2021 | 1501737000 | 1037863000 |
| Saturday, January 1, 2022 | 1603594000 | 1426851000 |
| Sunday, January 1, 2023 | 2089339000 | 1265392000 |
Unleashing insights
In the competitive landscape of industrial services and logistics, EMCOR Group, Inc. and TFI International Inc. have shown remarkable growth in gross profit over the past decade. From 2014 to 2023, EMCOR Group's gross profit surged by approximately 130%, reaching its peak in 2023. This growth reflects the company's strategic expansion and operational efficiency. Meanwhile, TFI International Inc. also demonstrated impressive growth, with its gross profit increasing by nearly 200% during the same period, highlighting its robust market presence and adaptability.
By 2023, EMCOR Group's gross profit was about 65% higher than TFI International's, showcasing its dominance in the sector. However, TFI's rapid growth trajectory suggests a promising future. This analysis underscores the dynamic nature of the industry and the importance of strategic planning in achieving financial success.
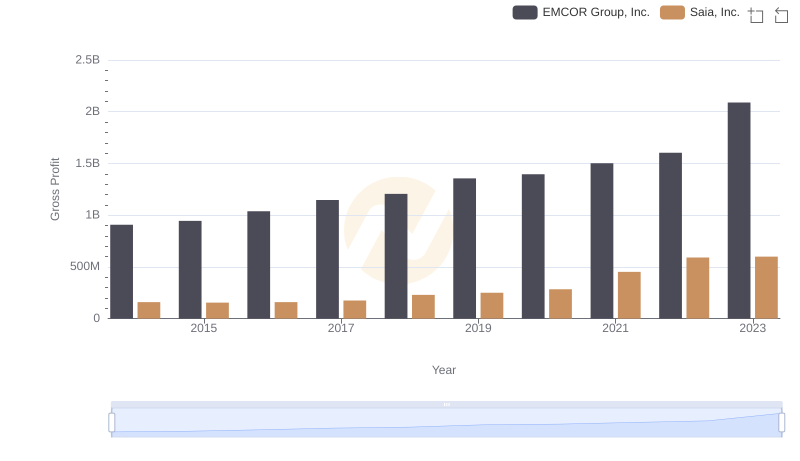
Gross Profit Trends Compared: EMCOR Group, Inc. vs Saia, Inc.
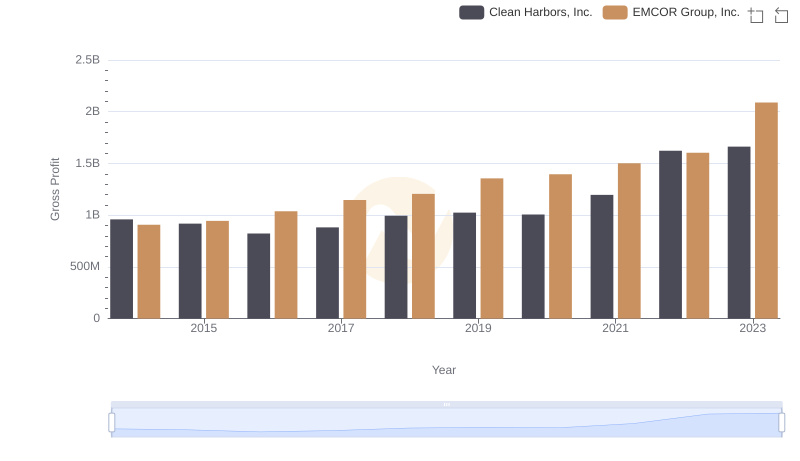
EMCOR Group, Inc. and Clean Harbors, Inc.: A Detailed Gross Profit Analysis
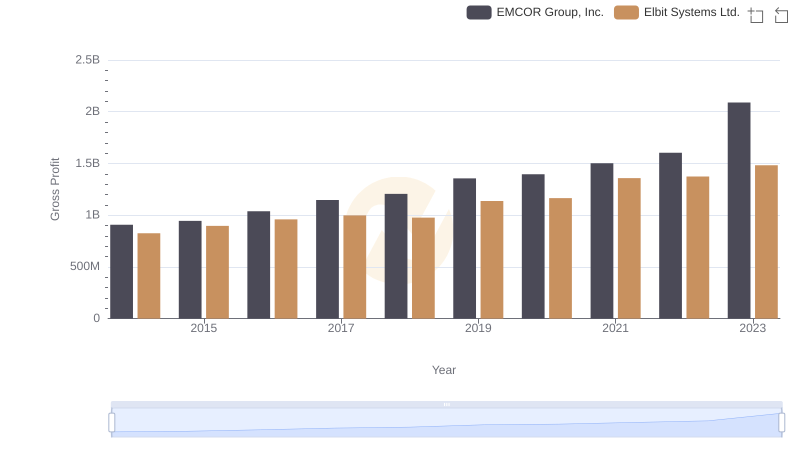
EMCOR Group, Inc. vs Elbit Systems Ltd.: A Gross Profit Performance Breakdown
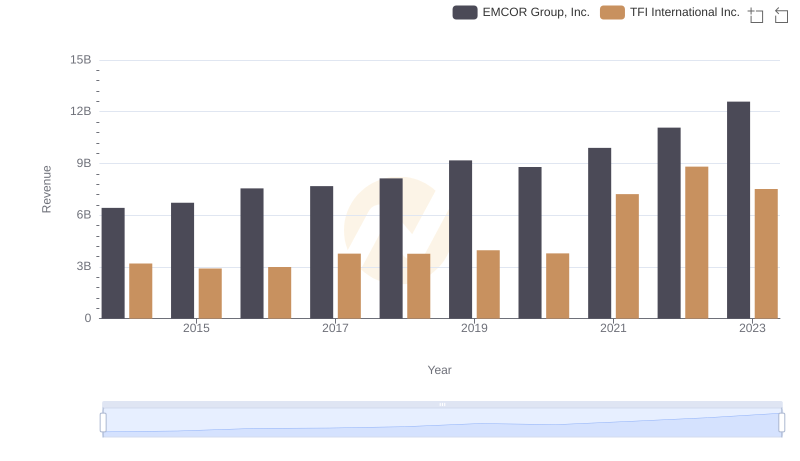
Comparing Revenue Performance: EMCOR Group, Inc. or TFI International Inc.?
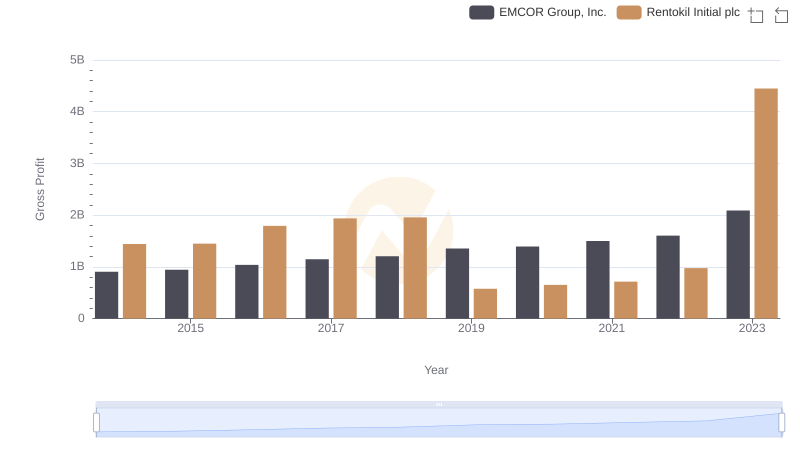
Who Generates Higher Gross Profit? EMCOR Group, Inc. or Rentokil Initial plc
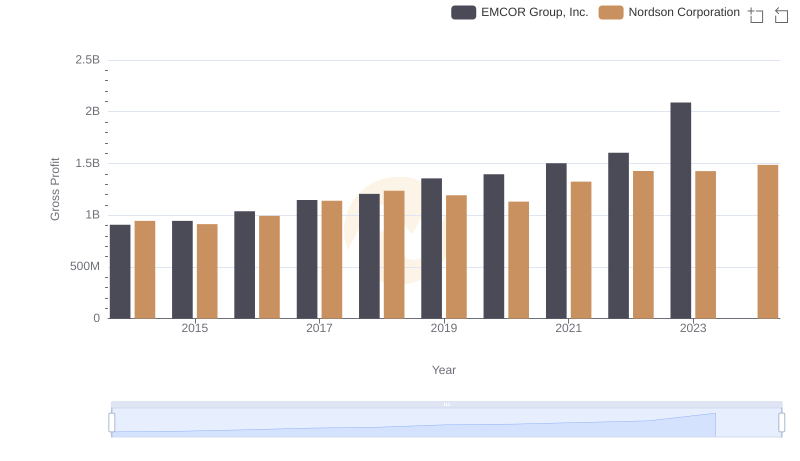
Key Insights on Gross Profit: EMCOR Group, Inc. vs Nordson Corporation
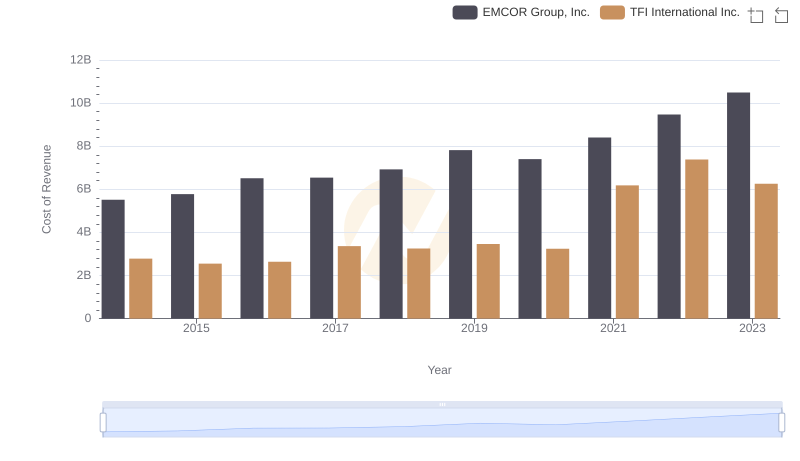
EMCOR Group, Inc. vs TFI International Inc.: Efficiency in Cost of Revenue Explored
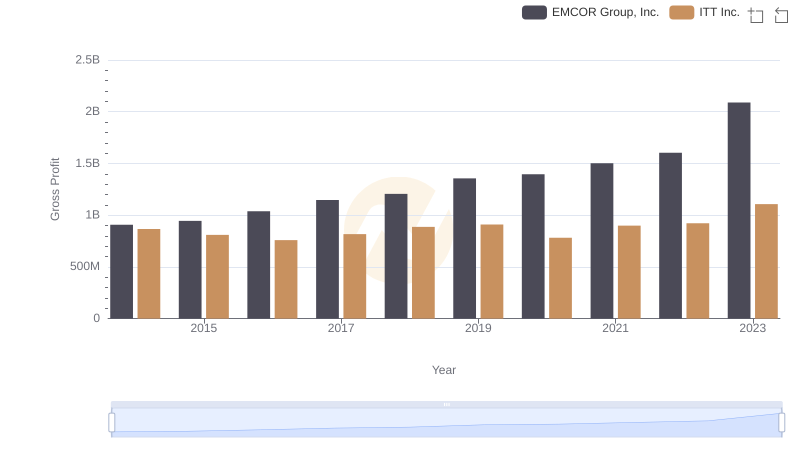
Who Generates Higher Gross Profit? EMCOR Group, Inc. or ITT Inc.
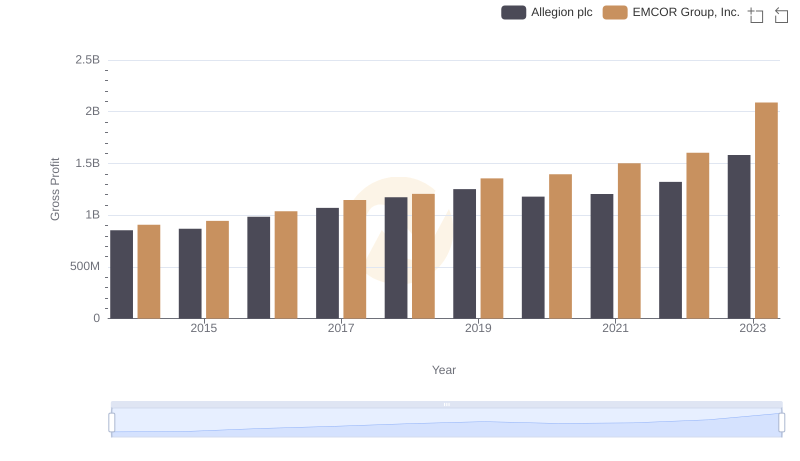
Gross Profit Trends Compared: EMCOR Group, Inc. vs Allegion plc
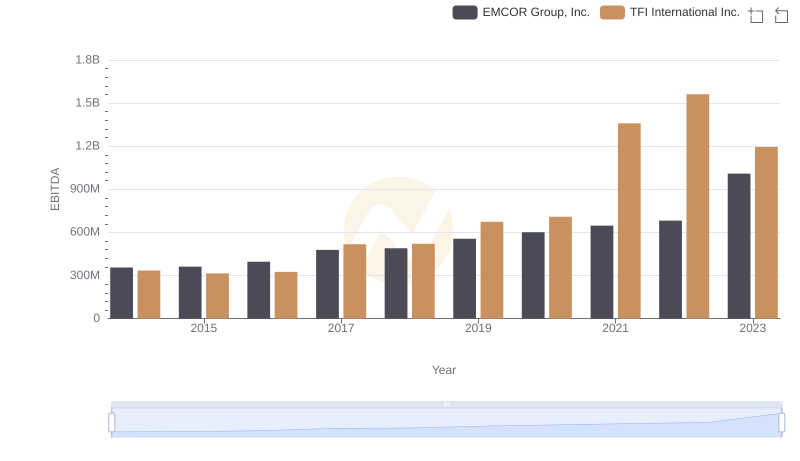
EMCOR Group, Inc. vs TFI International Inc.: In-Depth EBITDA Performance Comparison