| __timestamp | EMCOR Group, Inc. | Pool Corporation |
|---|---|---|
| Wednesday, January 1, 2014 | 355858000 | 204752000 |
| Thursday, January 1, 2015 | 362095000 | 233610000 |
| Friday, January 1, 2016 | 395913000 | 277836000 |
| Sunday, January 1, 2017 | 478459000 | 310096000 |
| Monday, January 1, 2018 | 489954000 | 341804000 |
| Tuesday, January 1, 2019 | 556055000 | 370520000 |
| Wednesday, January 1, 2020 | 601449000 | 493425000 |
| Friday, January 1, 2021 | 646861000 | 862810000 |
| Saturday, January 1, 2022 | 682399000 | 1064808000 |
| Sunday, January 1, 2023 | 1009017000 | 786707000 |
Unveiling the hidden dimensions of data
In the competitive landscape of the construction and pool supply industries, EMCOR Group, Inc. and Pool Corporation have shown remarkable financial performance over the past decade. From 2014 to 2023, EMCOR Group, Inc. has seen its EBITDA grow by approximately 183%, while Pool Corporation experienced an impressive 284% increase. This growth highlights the resilience and strategic prowess of both companies in navigating market challenges.
These trends underscore the dynamic nature of these industries and the strategic shifts companies must undertake to maintain competitive advantage.
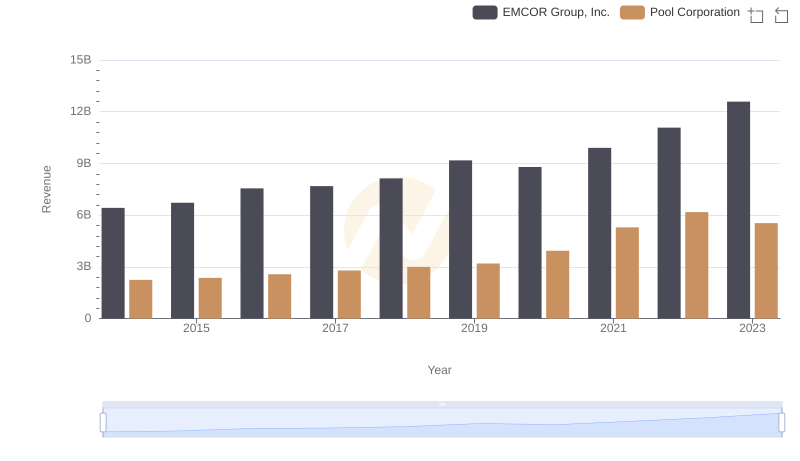
Annual Revenue Comparison: EMCOR Group, Inc. vs Pool Corporation
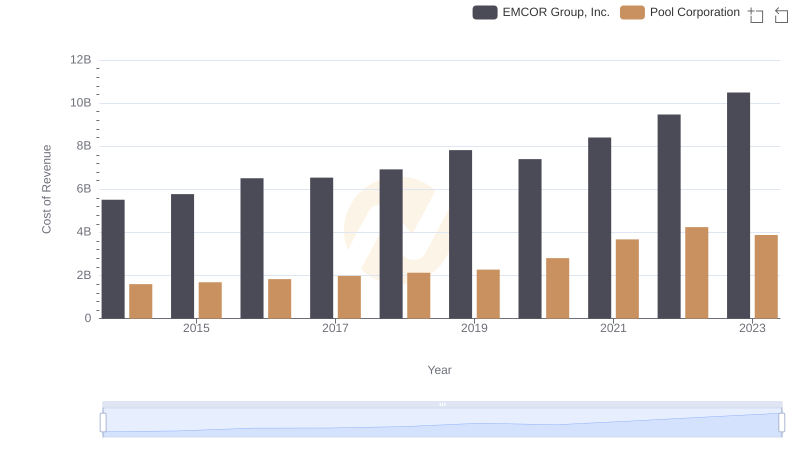
Cost of Revenue Comparison: EMCOR Group, Inc. vs Pool Corporation
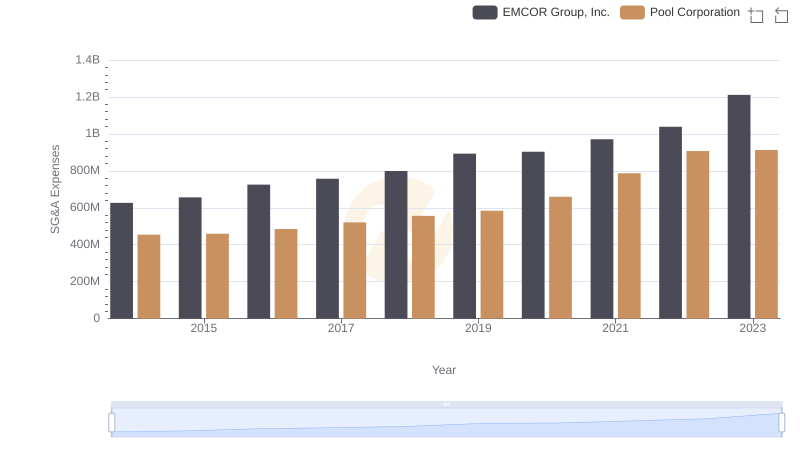
EMCOR Group, Inc. vs Pool Corporation: SG&A Expense Trends
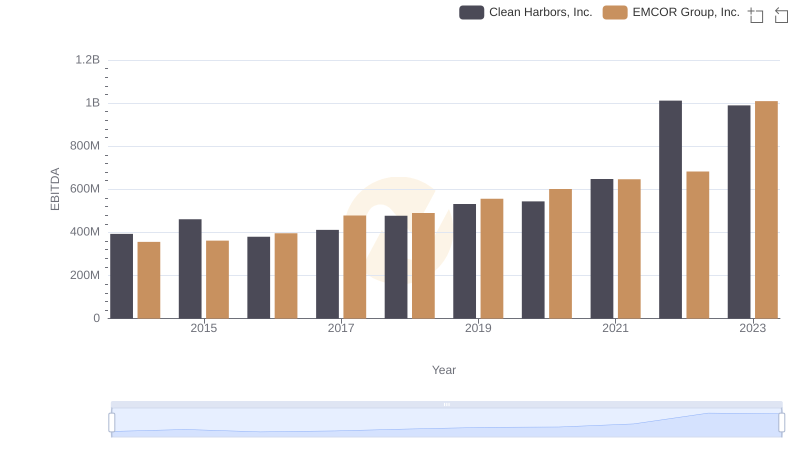
EBITDA Metrics Evaluated: EMCOR Group, Inc. vs Clean Harbors, Inc.
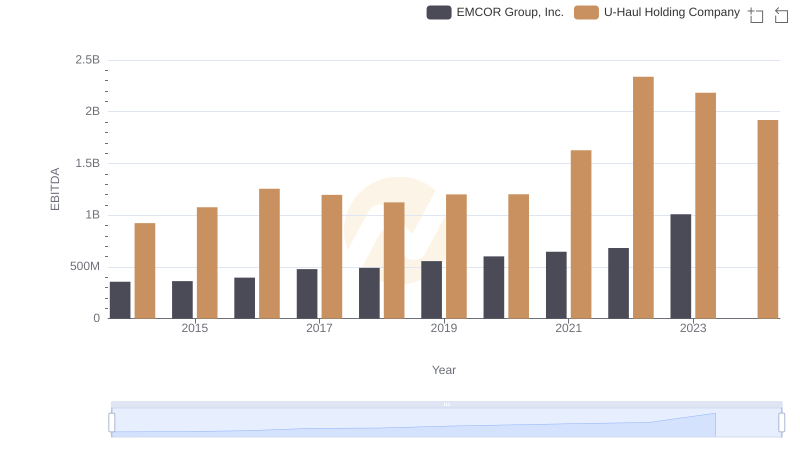
Professional EBITDA Benchmarking: EMCOR Group, Inc. vs U-Haul Holding Company
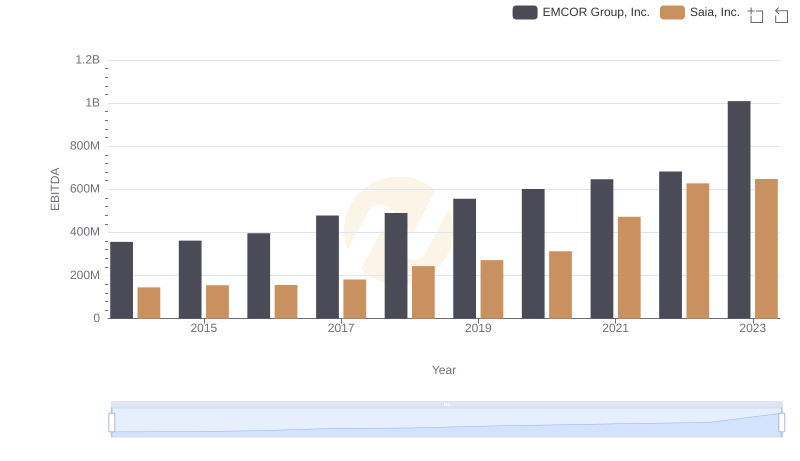
A Side-by-Side Analysis of EBITDA: EMCOR Group, Inc. and Saia, Inc.
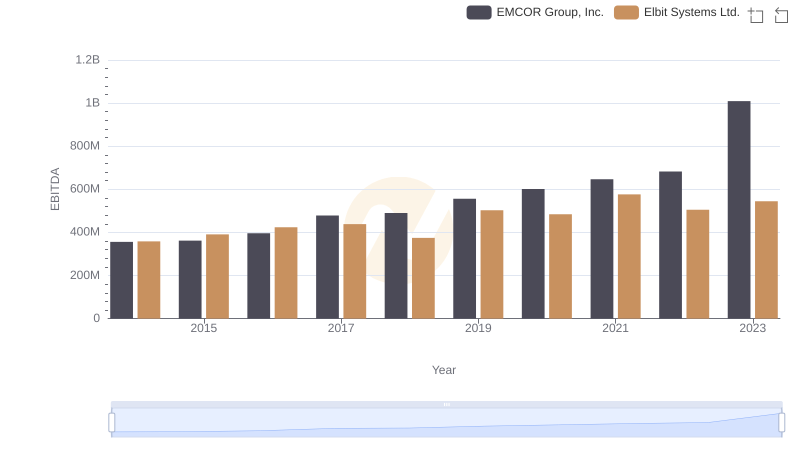
Professional EBITDA Benchmarking: EMCOR Group, Inc. vs Elbit Systems Ltd.
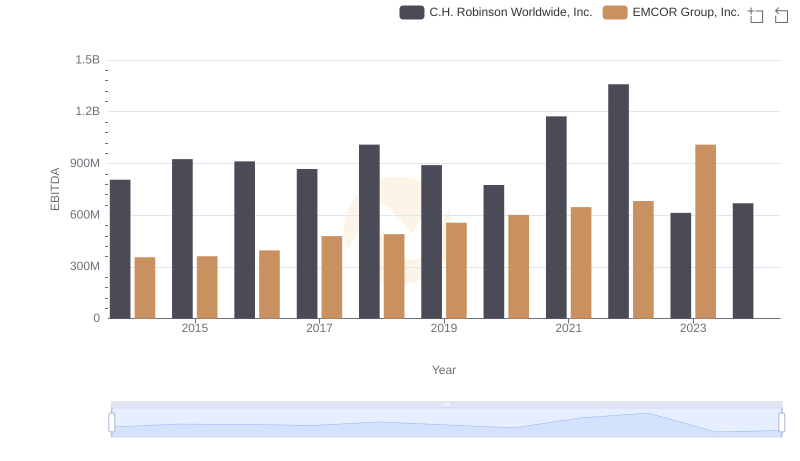
Comparative EBITDA Analysis: EMCOR Group, Inc. vs C.H. Robinson Worldwide, Inc.
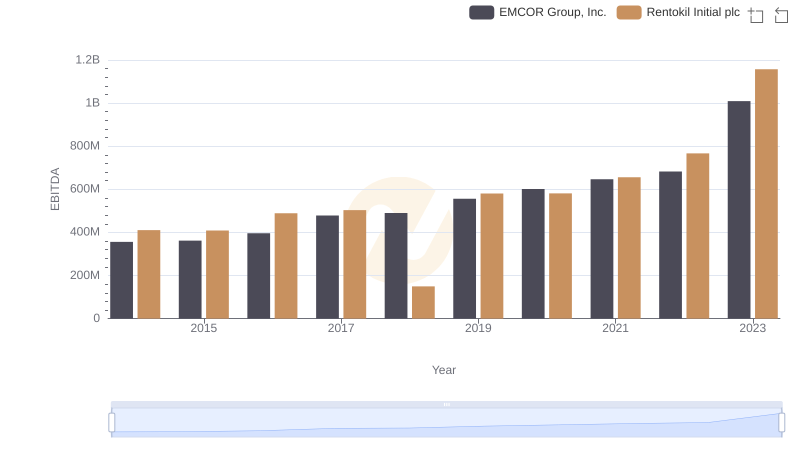
EBITDA Performance Review: EMCOR Group, Inc. vs Rentokil Initial plc
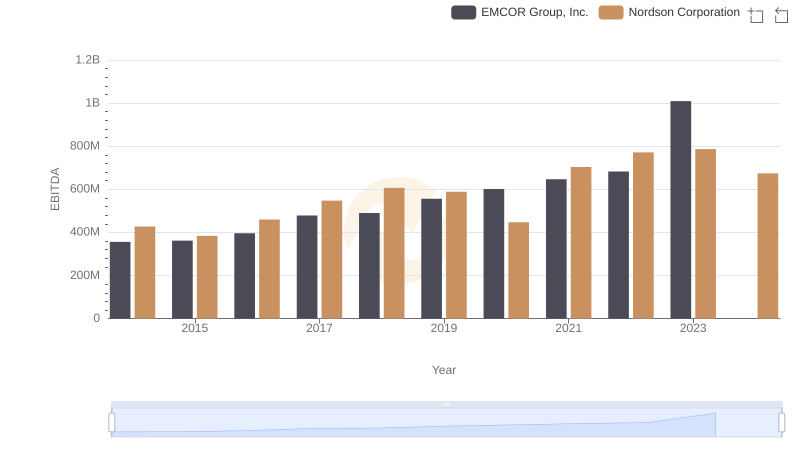
EBITDA Analysis: Evaluating EMCOR Group, Inc. Against Nordson Corporation
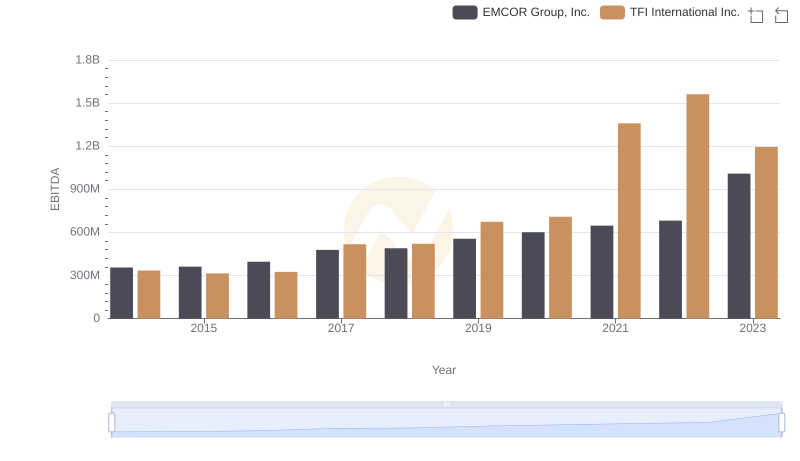
EMCOR Group, Inc. vs TFI International Inc.: In-Depth EBITDA Performance Comparison