| __timestamp | Clean Harbors, Inc. | EMCOR Group, Inc. |
|---|---|---|
| Wednesday, January 1, 2014 | 393092000 | 355858000 |
| Thursday, January 1, 2015 | 461019000 | 362095000 |
| Friday, January 1, 2016 | 380027000 | 395913000 |
| Sunday, January 1, 2017 | 411975000 | 478459000 |
| Monday, January 1, 2018 | 477159000 | 489954000 |
| Tuesday, January 1, 2019 | 531861000 | 556055000 |
| Wednesday, January 1, 2020 | 544047000 | 601449000 |
| Friday, January 1, 2021 | 647725000 | 646861000 |
| Saturday, January 1, 2022 | 1011488000 | 682399000 |
| Sunday, January 1, 2023 | 989565000 | 1009017000 |
| Monday, January 1, 2024 | 799401000 |
Unveiling the hidden dimensions of data
In the competitive landscape of industrial services, EMCOR Group, Inc. and Clean Harbors, Inc. have demonstrated remarkable EBITDA growth over the past decade. From 2014 to 2023, both companies have shown resilience and adaptability, with Clean Harbors, Inc. experiencing a staggering 160% increase in EBITDA, peaking in 2022. Meanwhile, EMCOR Group, Inc. saw a robust 180% growth, culminating in 2023.
The journey began in 2014, with Clean Harbors, Inc. leading slightly. However, by 2023, EMCOR Group, Inc. had closed the gap, showcasing its strategic prowess. This period highlights the dynamic shifts in the industry, driven by innovation and strategic investments. As these companies continue to evolve, their financial trajectories offer valuable insights into the broader market trends.
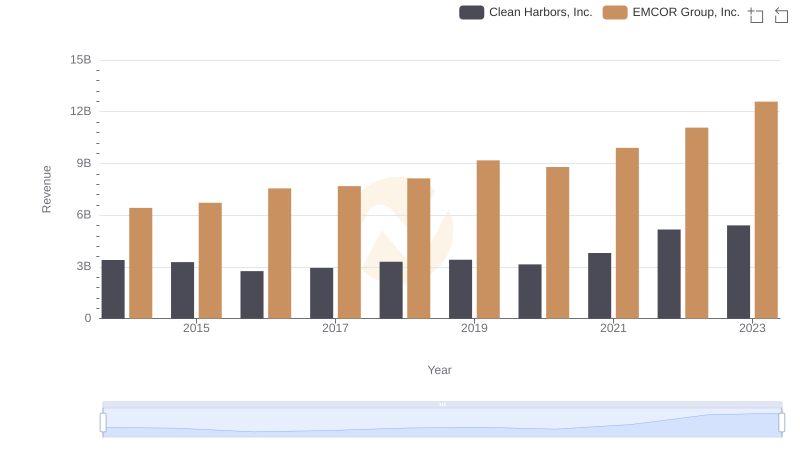
Breaking Down Revenue Trends: EMCOR Group, Inc. vs Clean Harbors, Inc.
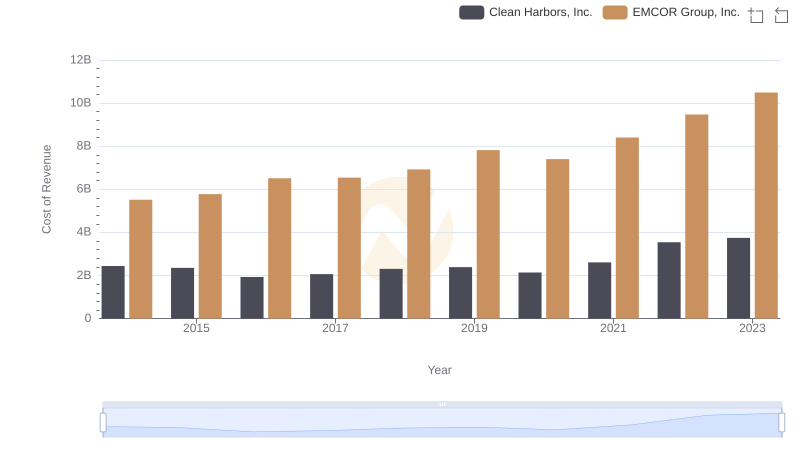
Cost of Revenue Trends: EMCOR Group, Inc. vs Clean Harbors, Inc.
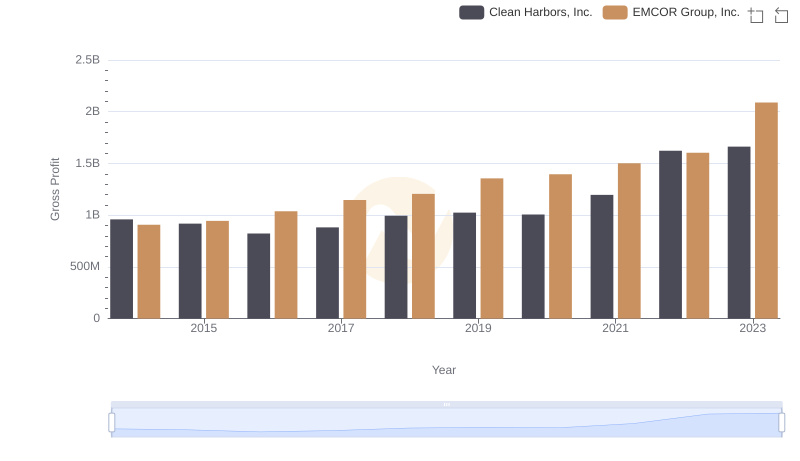
EMCOR Group, Inc. and Clean Harbors, Inc.: A Detailed Gross Profit Analysis
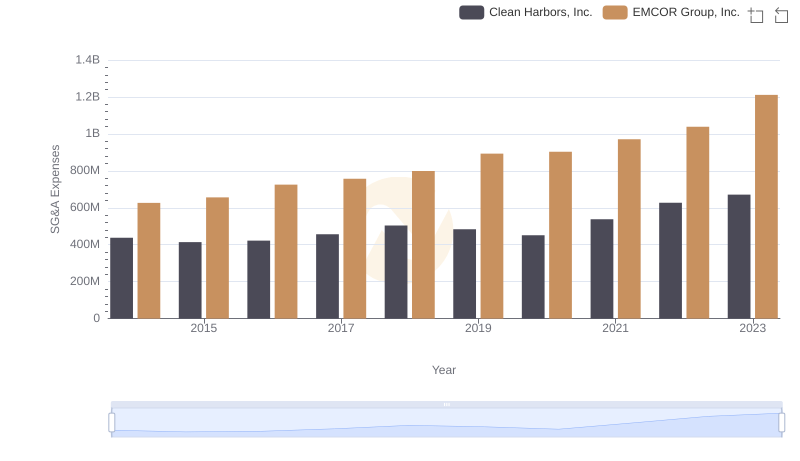
EMCOR Group, Inc. and Clean Harbors, Inc.: SG&A Spending Patterns Compared
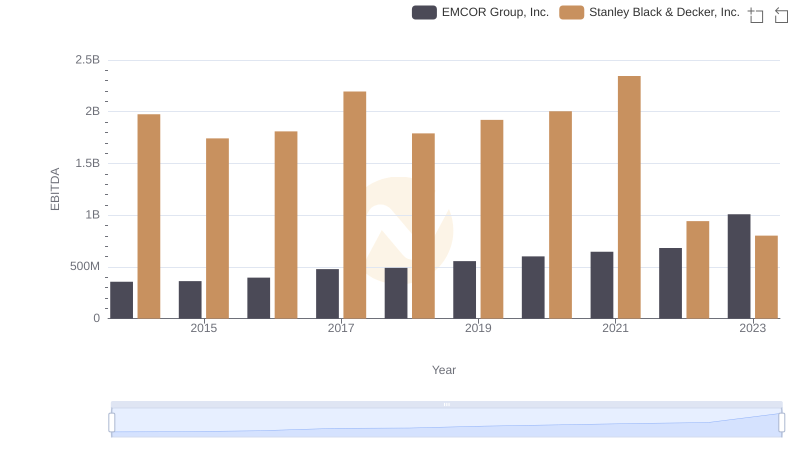
EMCOR Group, Inc. and Stanley Black & Decker, Inc.: A Detailed Examination of EBITDA Performance
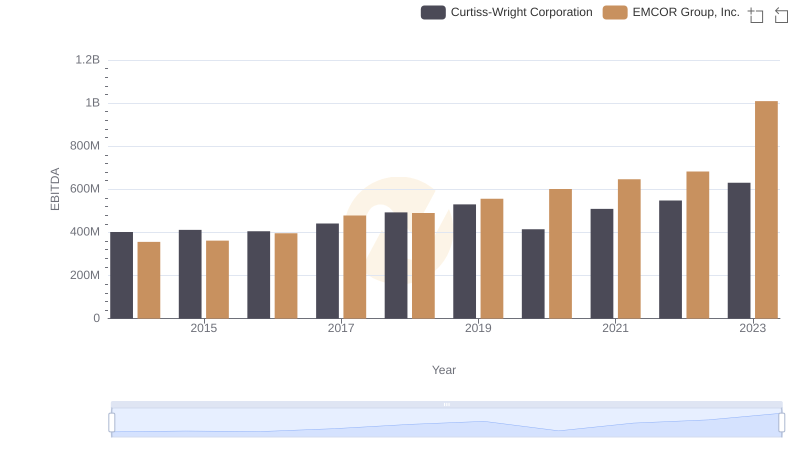
EBITDA Metrics Evaluated: EMCOR Group, Inc. vs Curtiss-Wright Corporation
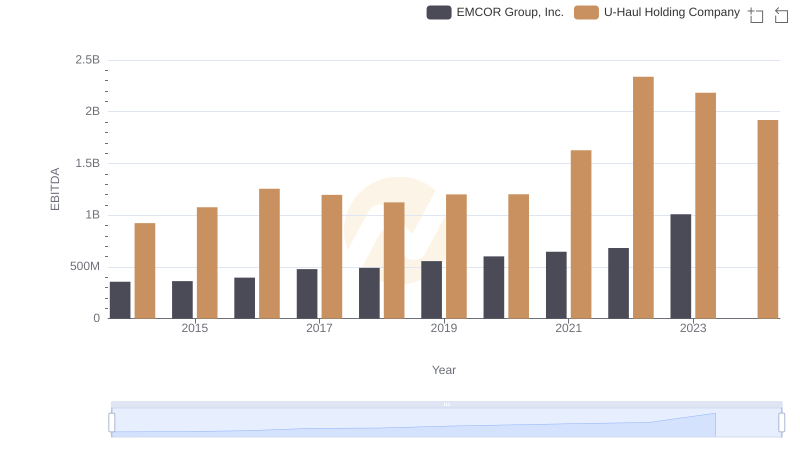
Professional EBITDA Benchmarking: EMCOR Group, Inc. vs U-Haul Holding Company
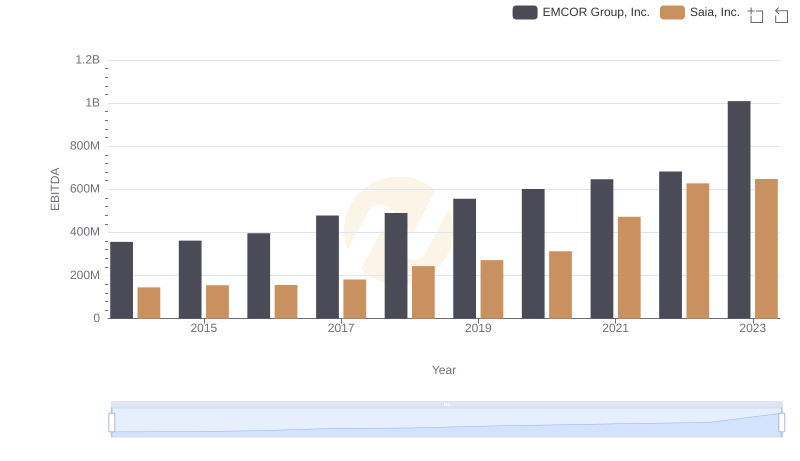
A Side-by-Side Analysis of EBITDA: EMCOR Group, Inc. and Saia, Inc.
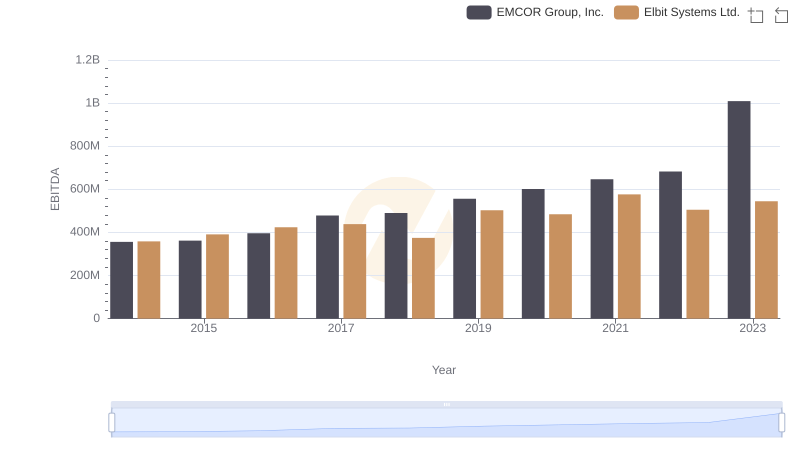
Professional EBITDA Benchmarking: EMCOR Group, Inc. vs Elbit Systems Ltd.
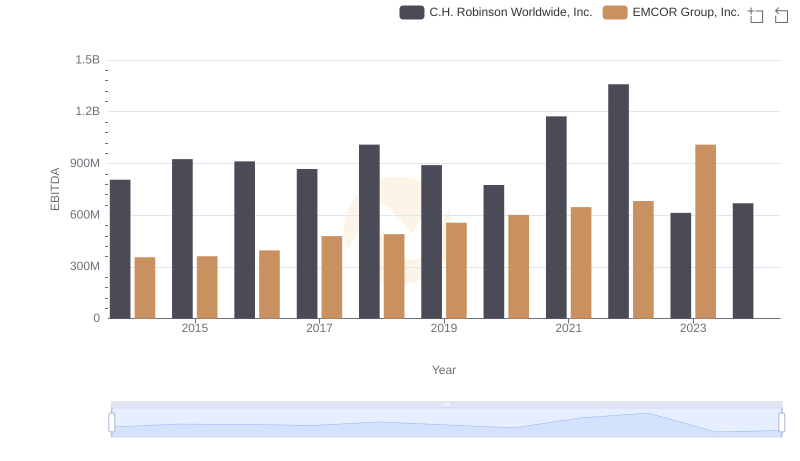
Comparative EBITDA Analysis: EMCOR Group, Inc. vs C.H. Robinson Worldwide, Inc.
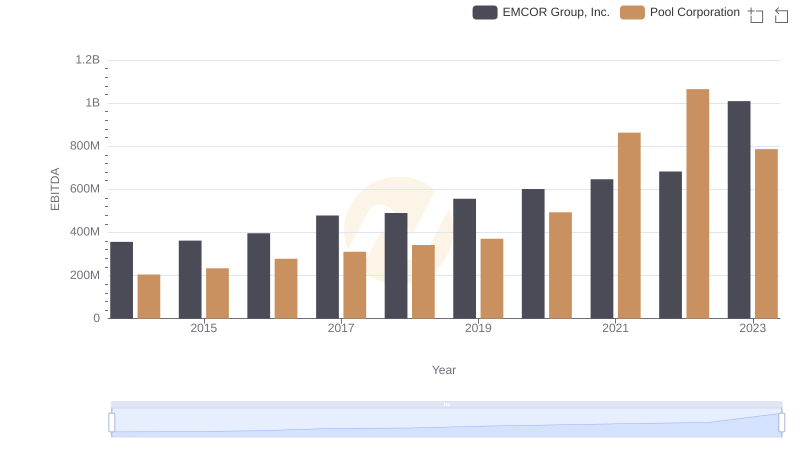
Professional EBITDA Benchmarking: EMCOR Group, Inc. vs Pool Corporation