| __timestamp | EMCOR Group, Inc. | Rentokil Initial plc |
|---|---|---|
| Wednesday, January 1, 2014 | 355858000 | 410400000 |
| Thursday, January 1, 2015 | 362095000 | 408700000 |
| Friday, January 1, 2016 | 395913000 | 489000000 |
| Sunday, January 1, 2017 | 478459000 | 503200000 |
| Monday, January 1, 2018 | 489954000 | 149800000 |
| Tuesday, January 1, 2019 | 556055000 | 580600000 |
| Wednesday, January 1, 2020 | 601449000 | 581000000 |
| Friday, January 1, 2021 | 646861000 | 656000000 |
| Saturday, January 1, 2022 | 682399000 | 767000000 |
| Sunday, January 1, 2023 | 1009017000 | 1157000000 |
Unleashing the power of data
In the competitive landscape of global business services, EMCOR Group, Inc. and Rentokil Initial plc have emerged as formidable players. Over the past decade, both companies have demonstrated impressive growth in their EBITDA, a key indicator of financial health and operational efficiency. From 2014 to 2023, EMCOR Group, Inc. saw its EBITDA surge by approximately 183%, while Rentokil Initial plc experienced a remarkable 182% increase. This growth trajectory highlights the resilience and strategic prowess of these industry leaders.
Starting in 2014, EMCOR's EBITDA was slightly behind Rentokil's, but by 2023, both companies had crossed the billion-dollar mark, with Rentokil leading by a narrow margin. This consistent upward trend underscores their ability to adapt and thrive in a dynamic market. As we look to the future, these companies are well-positioned to continue their upward momentum, setting benchmarks for others in the industry.
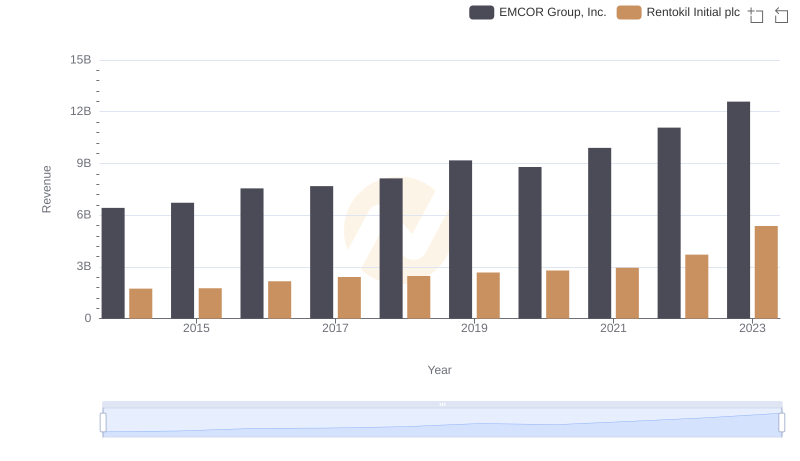
Who Generates More Revenue? EMCOR Group, Inc. or Rentokil Initial plc
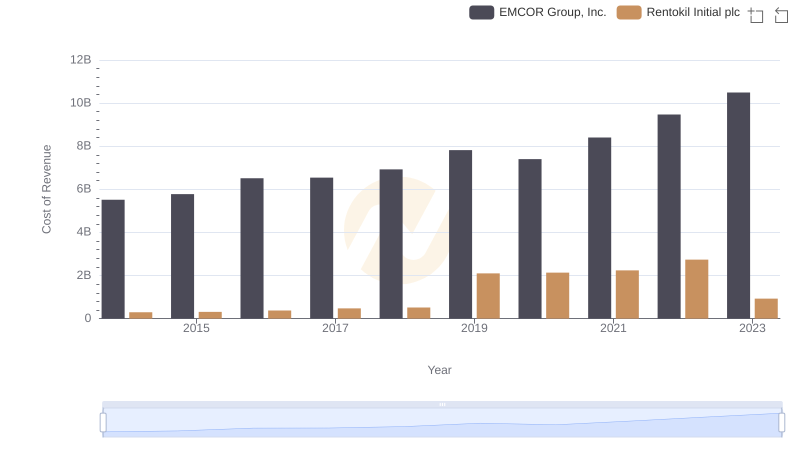
Analyzing Cost of Revenue: EMCOR Group, Inc. and Rentokil Initial plc
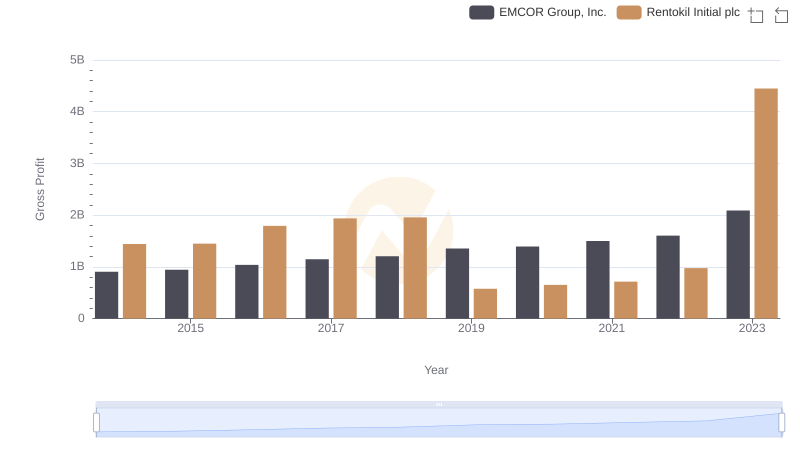
Who Generates Higher Gross Profit? EMCOR Group, Inc. or Rentokil Initial plc
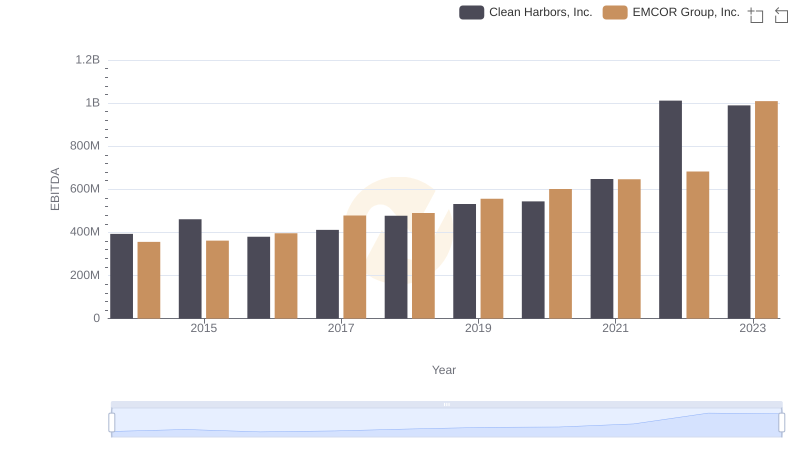
EBITDA Metrics Evaluated: EMCOR Group, Inc. vs Clean Harbors, Inc.
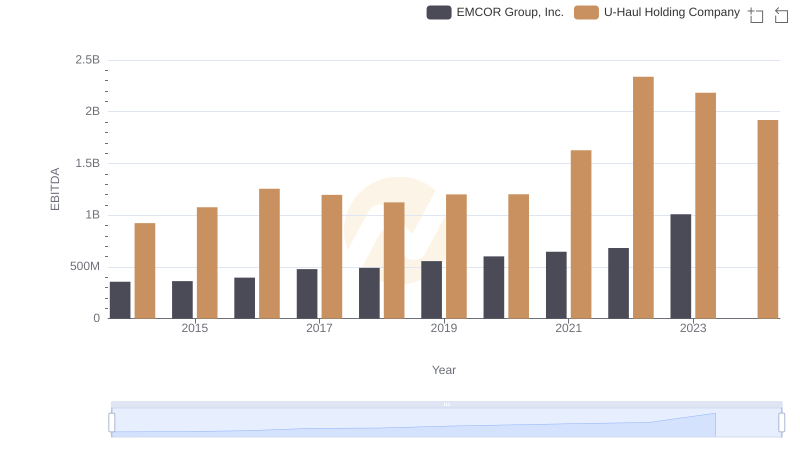
Professional EBITDA Benchmarking: EMCOR Group, Inc. vs U-Haul Holding Company
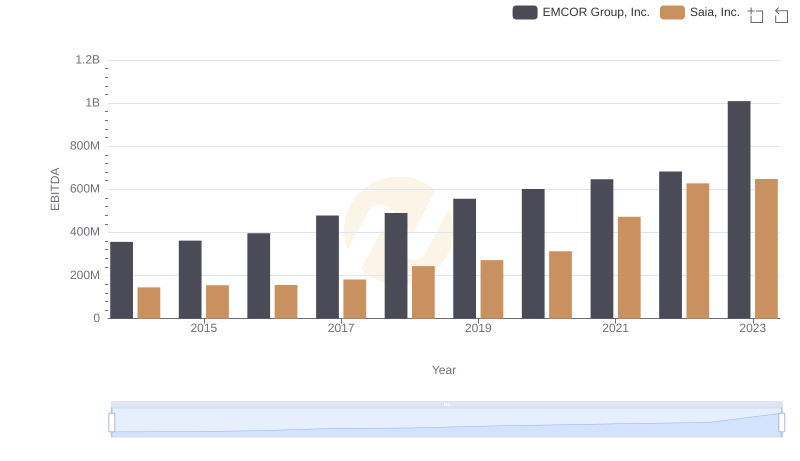
A Side-by-Side Analysis of EBITDA: EMCOR Group, Inc. and Saia, Inc.
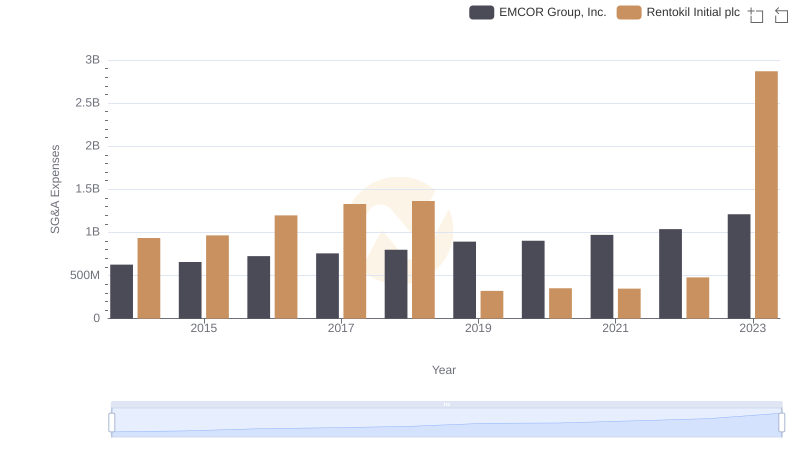
EMCOR Group, Inc. and Rentokil Initial plc: SG&A Spending Patterns Compared
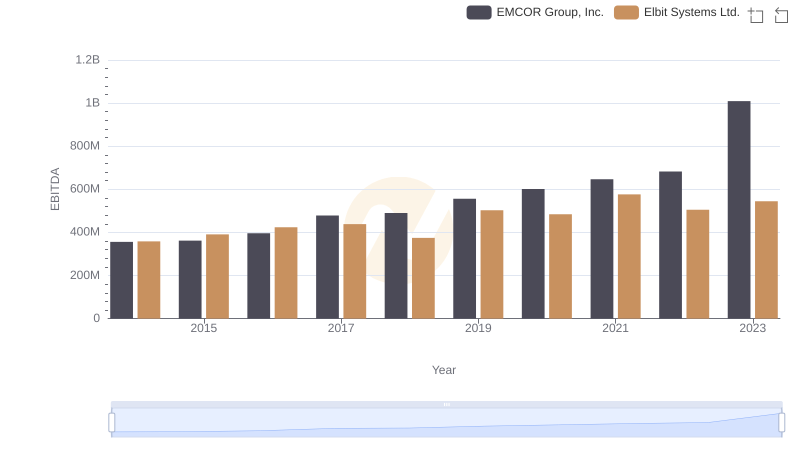
Professional EBITDA Benchmarking: EMCOR Group, Inc. vs Elbit Systems Ltd.
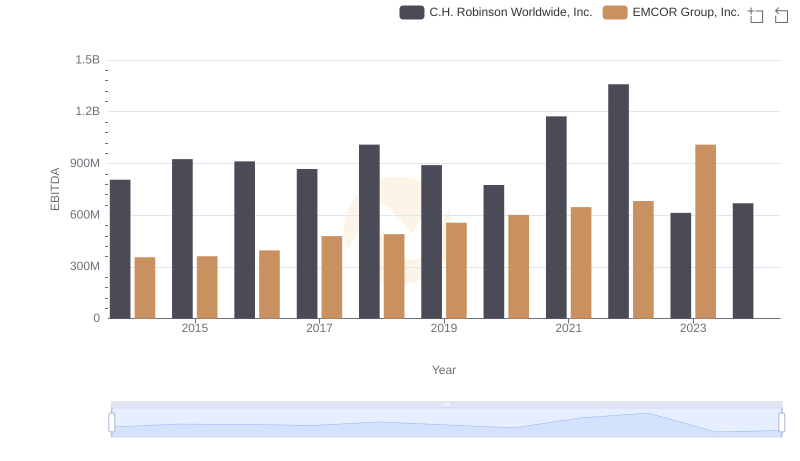
Comparative EBITDA Analysis: EMCOR Group, Inc. vs C.H. Robinson Worldwide, Inc.
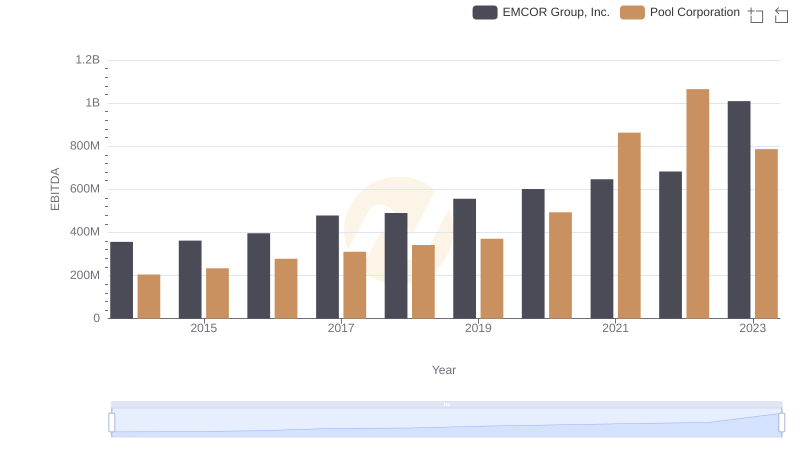
Professional EBITDA Benchmarking: EMCOR Group, Inc. vs Pool Corporation
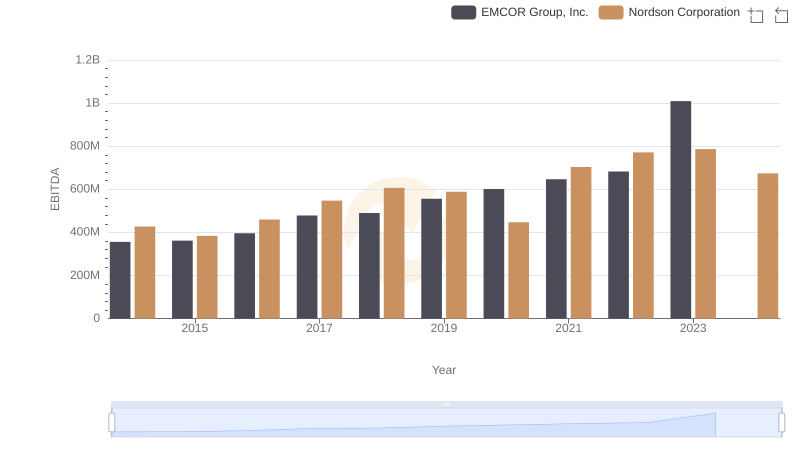
EBITDA Analysis: Evaluating EMCOR Group, Inc. Against Nordson Corporation
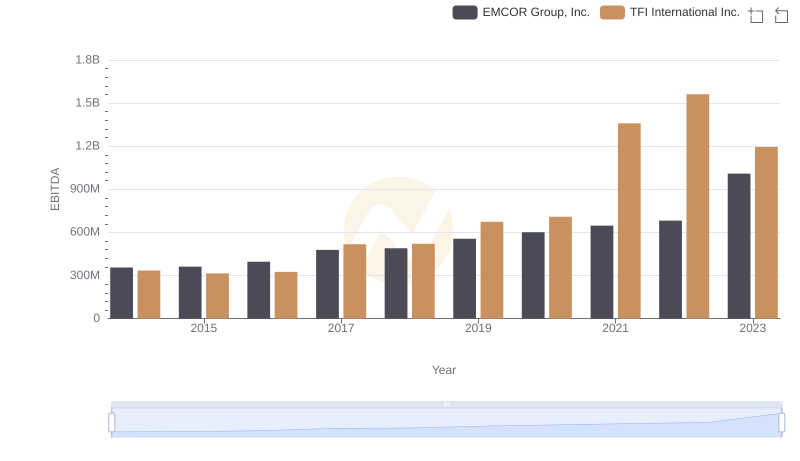
EMCOR Group, Inc. vs TFI International Inc.: In-Depth EBITDA Performance Comparison