| __timestamp | EMCOR Group, Inc. | Saia, Inc. |
|---|---|---|
| Wednesday, January 1, 2014 | 355858000 | 144715000 |
| Thursday, January 1, 2015 | 362095000 | 154995000 |
| Friday, January 1, 2016 | 395913000 | 156092000 |
| Sunday, January 1, 2017 | 478459000 | 181629000 |
| Monday, January 1, 2018 | 489954000 | 243709000 |
| Tuesday, January 1, 2019 | 556055000 | 271318000 |
| Wednesday, January 1, 2020 | 601449000 | 312448000 |
| Friday, January 1, 2021 | 646861000 | 472947000 |
| Saturday, January 1, 2022 | 682399000 | 627741000 |
| Sunday, January 1, 2023 | 1009017000 | 647607000 |
Unleashing insights
In the ever-evolving landscape of the U.S. stock market, understanding the financial health of companies is crucial. This analysis delves into the EBITDA performance of two industry giants, EMCOR Group, Inc. and Saia, Inc., from 2014 to 2023. Over this period, EMCOR Group, Inc. has demonstrated a robust growth trajectory, with its EBITDA surging by approximately 183%, reaching a peak in 2023. In contrast, Saia, Inc. has also shown impressive growth, with its EBITDA increasing by around 347% over the same period. This side-by-side comparison highlights the resilience and strategic prowess of both companies in navigating market challenges. As we look to the future, these trends offer valuable insights for investors and stakeholders aiming to make informed decisions in the dynamic world of finance.
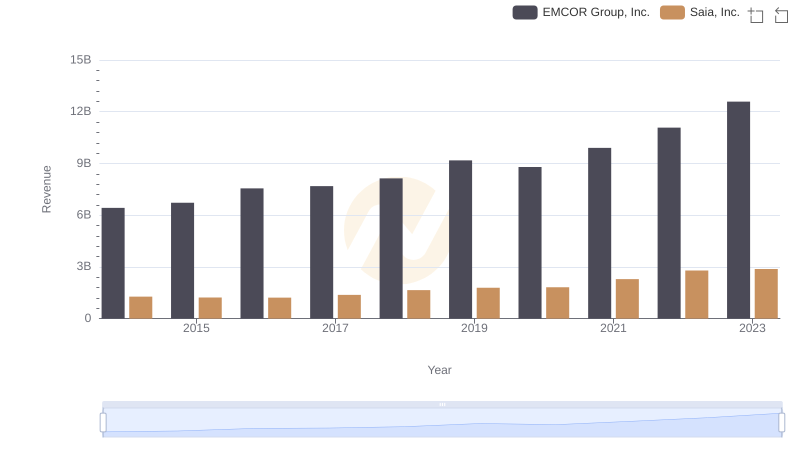
EMCOR Group, Inc. or Saia, Inc.: Who Leads in Yearly Revenue?

Comparing Cost of Revenue Efficiency: EMCOR Group, Inc. vs Saia, Inc.
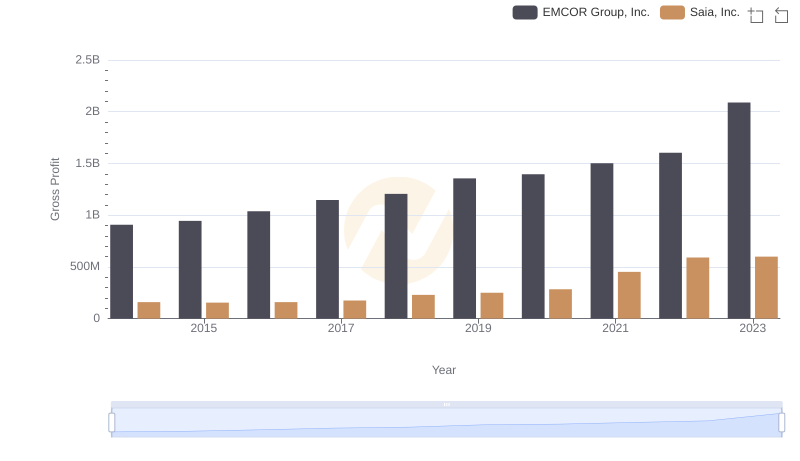
Gross Profit Trends Compared: EMCOR Group, Inc. vs Saia, Inc.
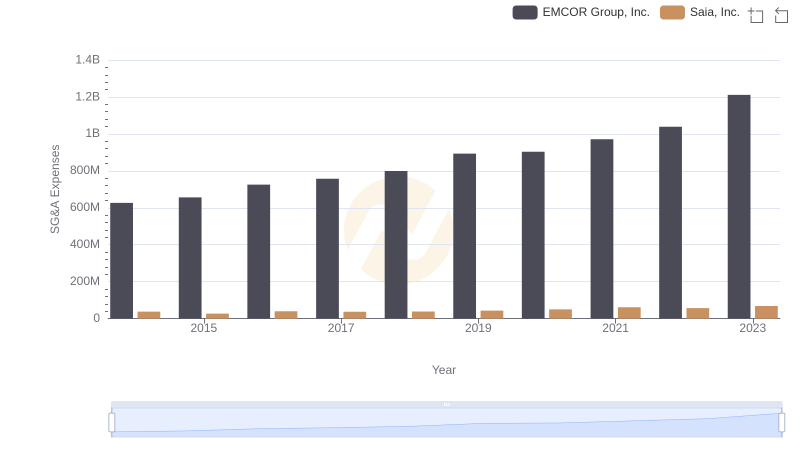
SG&A Efficiency Analysis: Comparing EMCOR Group, Inc. and Saia, Inc.
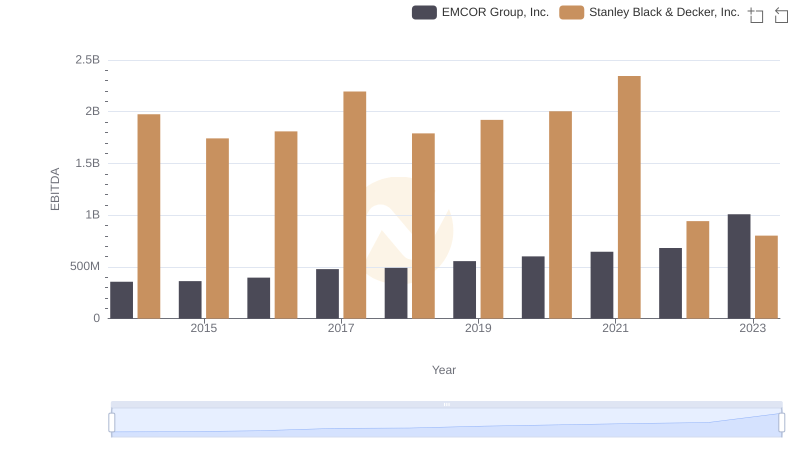
EMCOR Group, Inc. and Stanley Black & Decker, Inc.: A Detailed Examination of EBITDA Performance
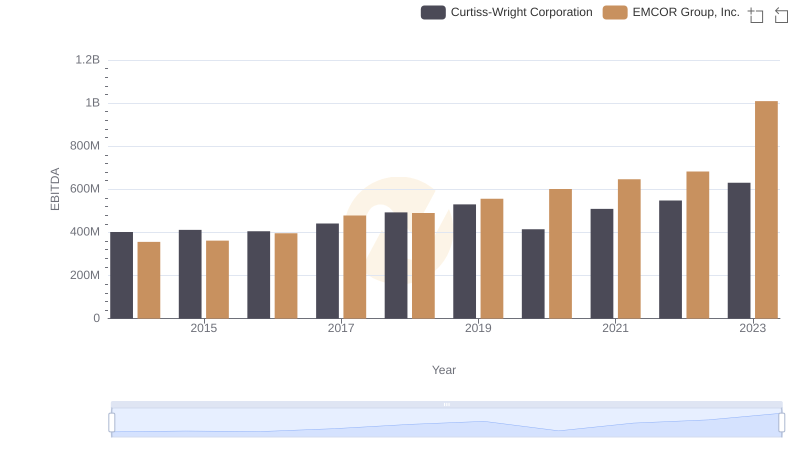
EBITDA Metrics Evaluated: EMCOR Group, Inc. vs Curtiss-Wright Corporation
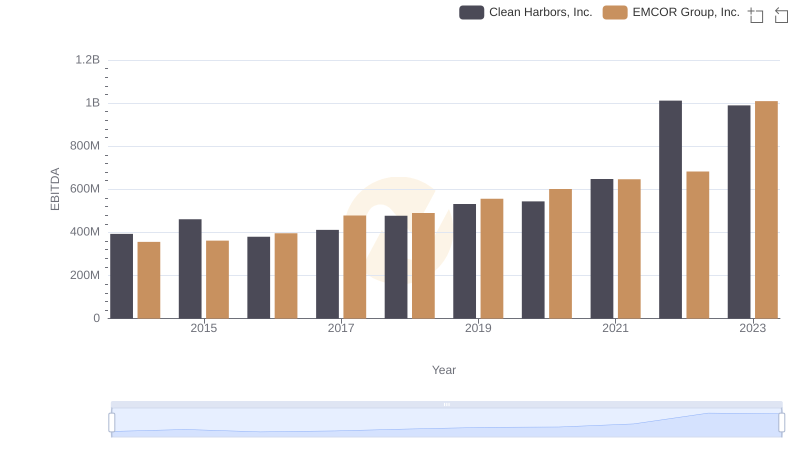
EBITDA Metrics Evaluated: EMCOR Group, Inc. vs Clean Harbors, Inc.
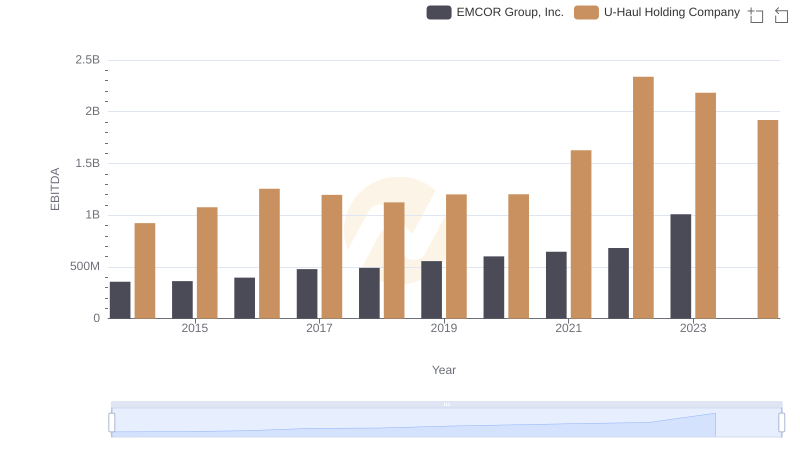
Professional EBITDA Benchmarking: EMCOR Group, Inc. vs U-Haul Holding Company
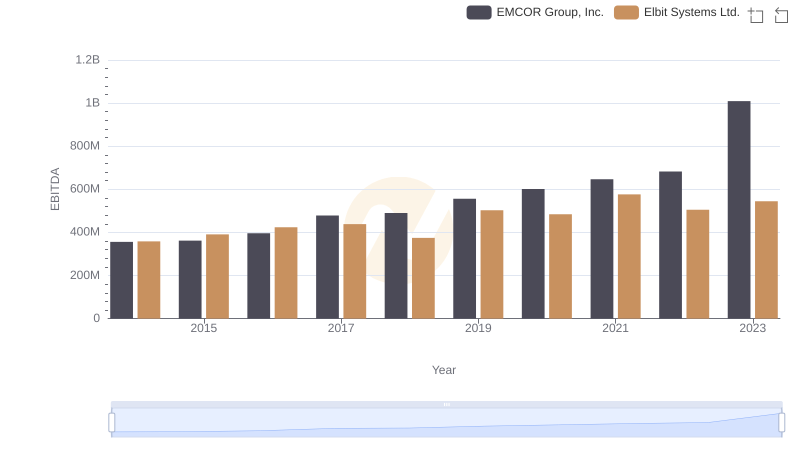
Professional EBITDA Benchmarking: EMCOR Group, Inc. vs Elbit Systems Ltd.
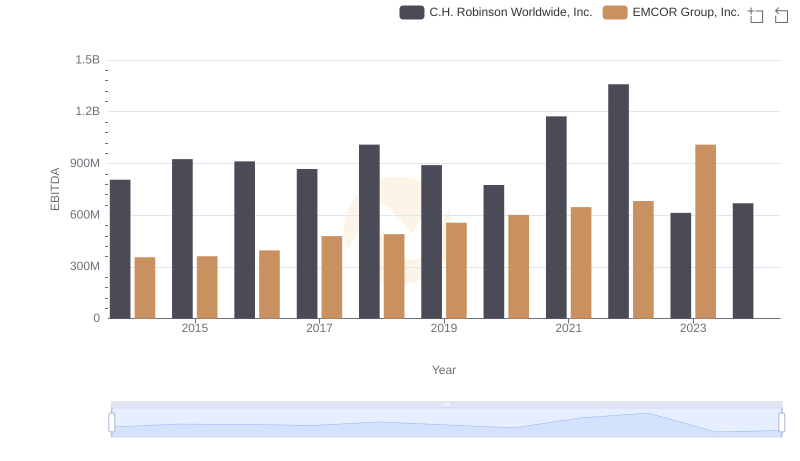
Comparative EBITDA Analysis: EMCOR Group, Inc. vs C.H. Robinson Worldwide, Inc.
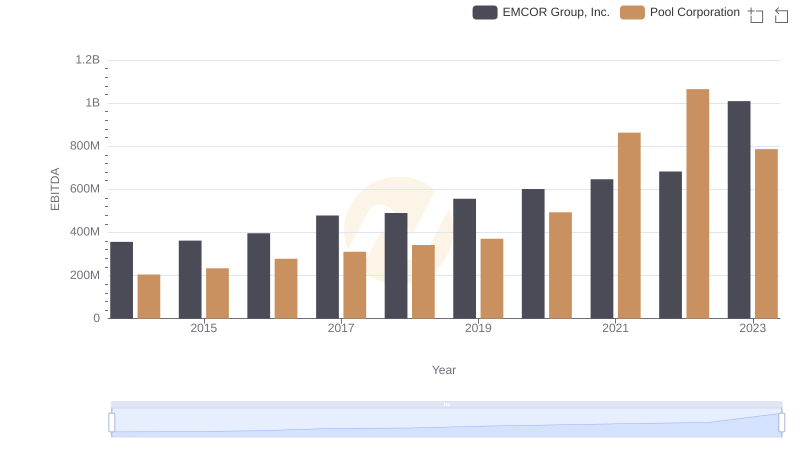
Professional EBITDA Benchmarking: EMCOR Group, Inc. vs Pool Corporation
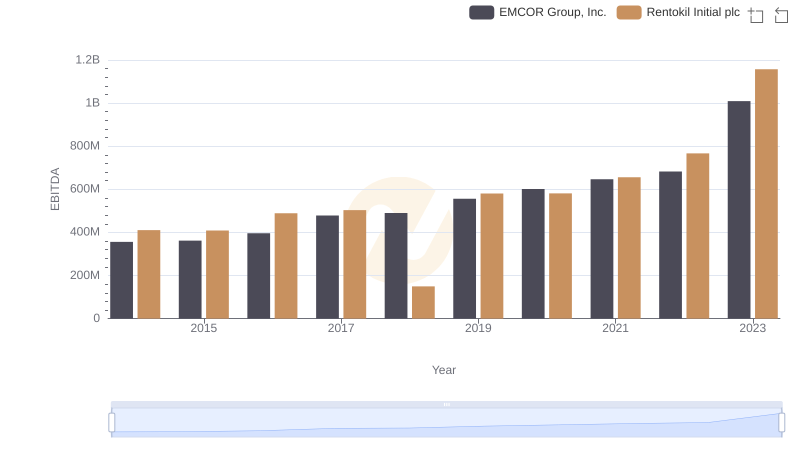
EBITDA Performance Review: EMCOR Group, Inc. vs Rentokil Initial plc