| __timestamp | Lennox International Inc. | Textron Inc. |
|---|---|---|
| Wednesday, January 1, 2014 | 387700000 | 1575000000 |
| Thursday, January 1, 2015 | 423600000 | 1601000000 |
| Friday, January 1, 2016 | 490800000 | 1484000000 |
| Sunday, January 1, 2017 | 562900000 | 1367000000 |
| Monday, January 1, 2018 | 575200000 | 1974000000 |
| Tuesday, January 1, 2019 | 633300000 | 1518000000 |
| Wednesday, January 1, 2020 | 553900000 | 827000000 |
| Friday, January 1, 2021 | 652500000 | 1391000000 |
| Saturday, January 1, 2022 | 729000000 | 1515000000 |
| Sunday, January 1, 2023 | 879500000 | 1556000000 |
| Monday, January 1, 2024 | 1034800000 | 1422000000 |
Unveiling the hidden dimensions of data
In the competitive landscape of industrial giants, Lennox International Inc. and Textron Inc. have showcased intriguing EBITDA trends over the past decade. From 2014 to 2024, Lennox International Inc. has seen a remarkable growth trajectory, with its EBITDA increasing by approximately 167%, peaking at over $1 billion in 2024. This growth reflects the company's strategic initiatives and market adaptability.
Conversely, Textron Inc. experienced a more volatile journey. Despite a strong start in 2014, with an EBITDA of around $1.6 billion, the company faced fluctuations, culminating in a significant dip in 2024. This decline, nearly 48% from its 2018 peak, highlights challenges in maintaining consistent growth.
These contrasting paths underscore the dynamic nature of the industrial sector, where strategic foresight and adaptability are key to sustained success.
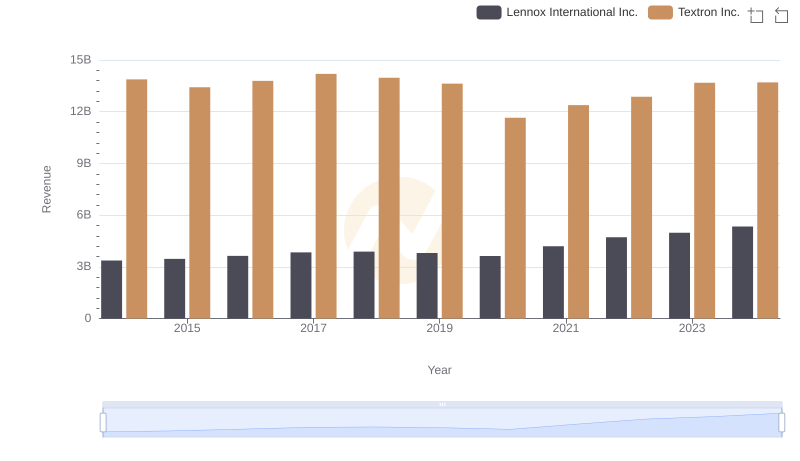
Lennox International Inc. vs Textron Inc.: Annual Revenue Growth Compared
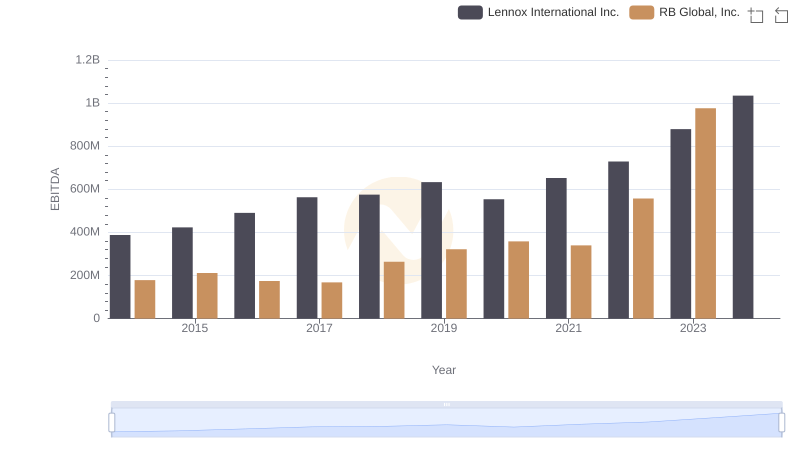
Lennox International Inc. and RB Global, Inc.: A Detailed Examination of EBITDA Performance
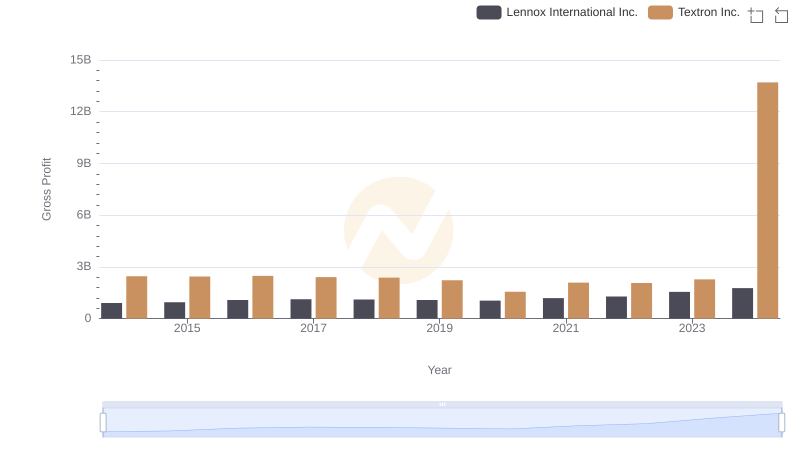
Gross Profit Comparison: Lennox International Inc. and Textron Inc. Trends
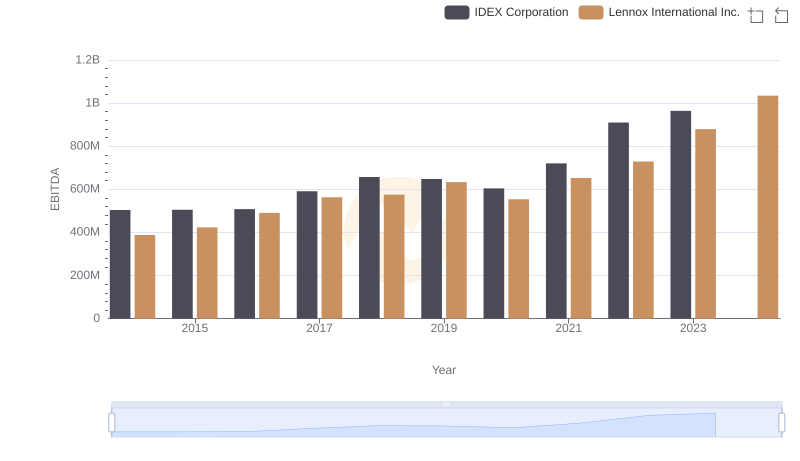
A Professional Review of EBITDA: Lennox International Inc. Compared to IDEX Corporation
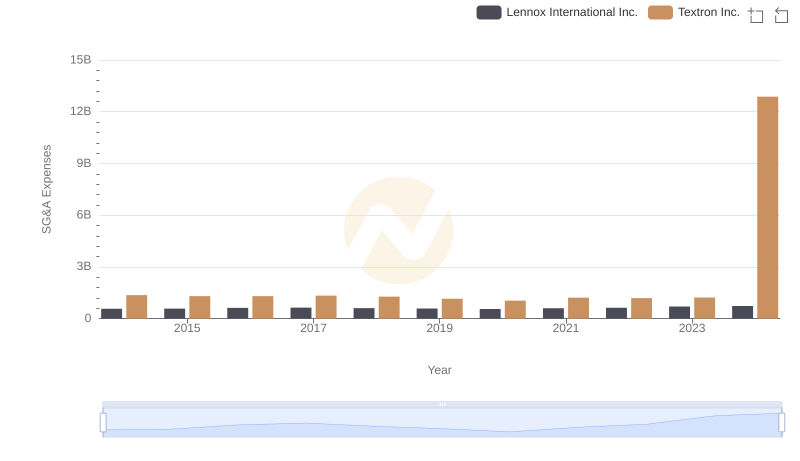
Lennox International Inc. or Textron Inc.: Who Manages SG&A Costs Better?
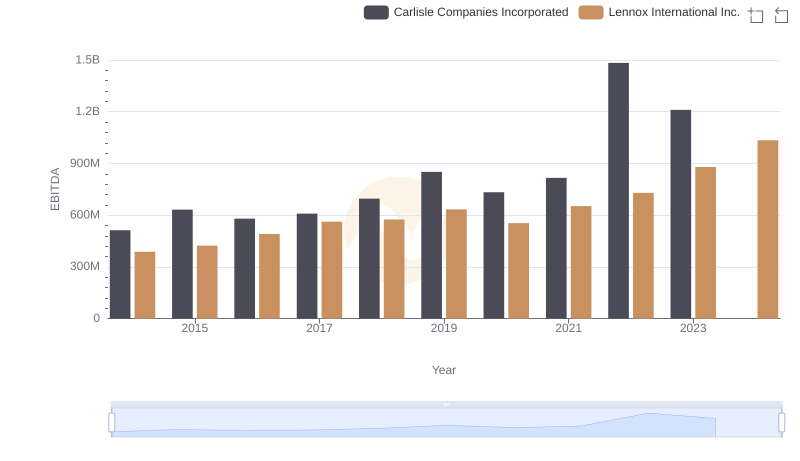
A Side-by-Side Analysis of EBITDA: Lennox International Inc. and Carlisle Companies Incorporated
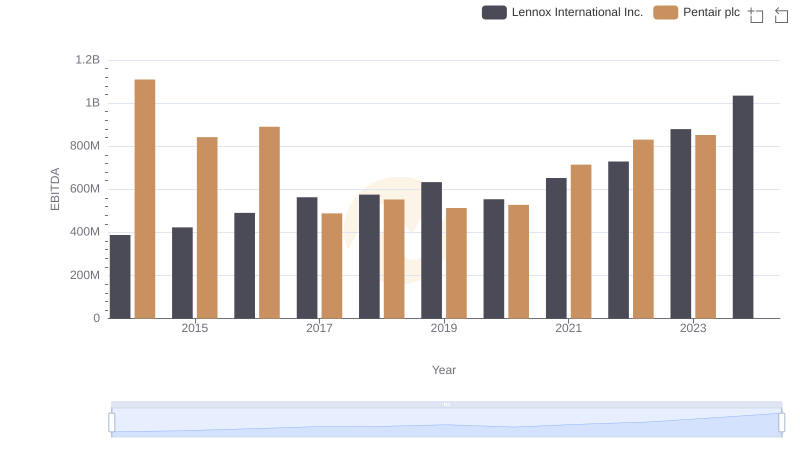
Comparative EBITDA Analysis: Lennox International Inc. vs Pentair plc
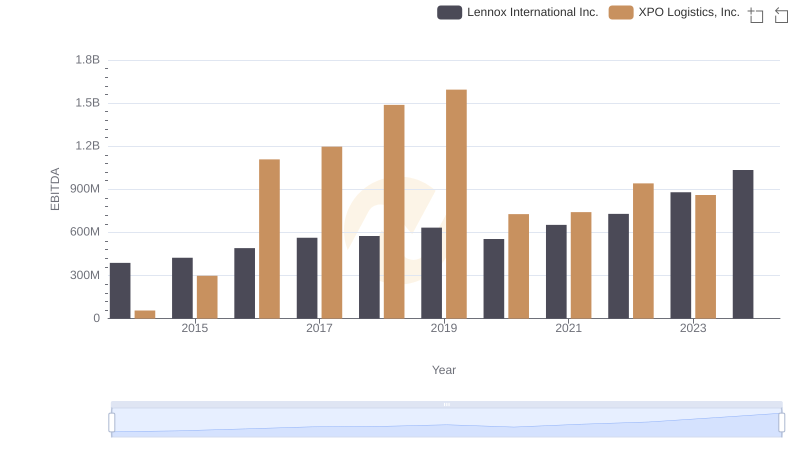
A Professional Review of EBITDA: Lennox International Inc. Compared to XPO Logistics, Inc.
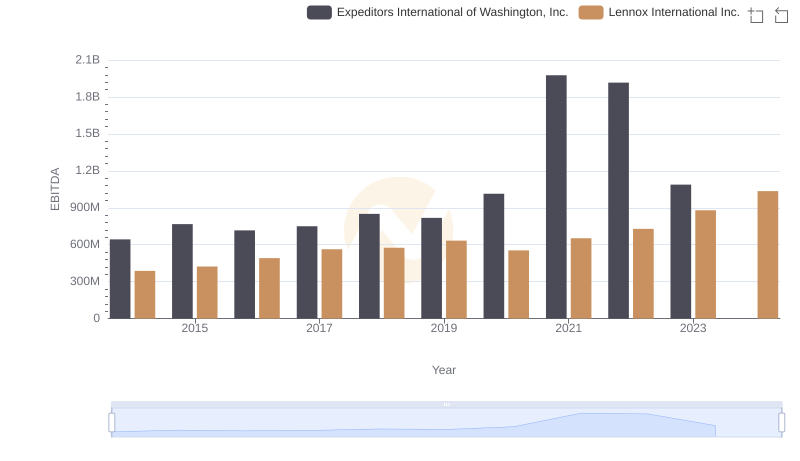
Lennox International Inc. and Expeditors International of Washington, Inc.: A Detailed Examination of EBITDA Performance
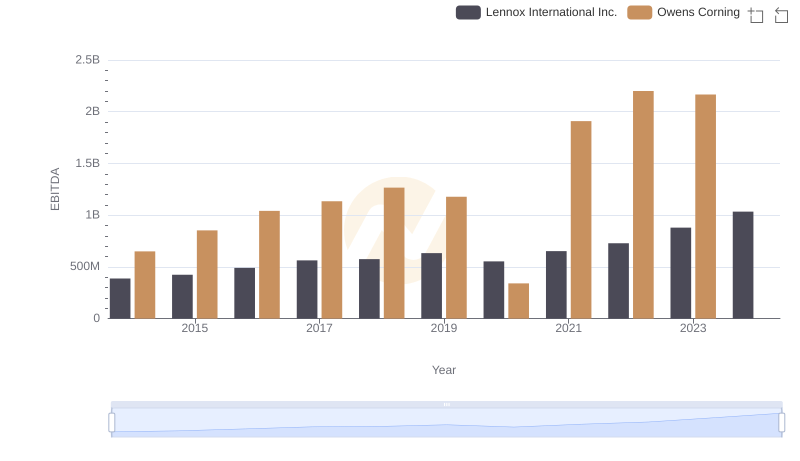
Comparative EBITDA Analysis: Lennox International Inc. vs Owens Corning
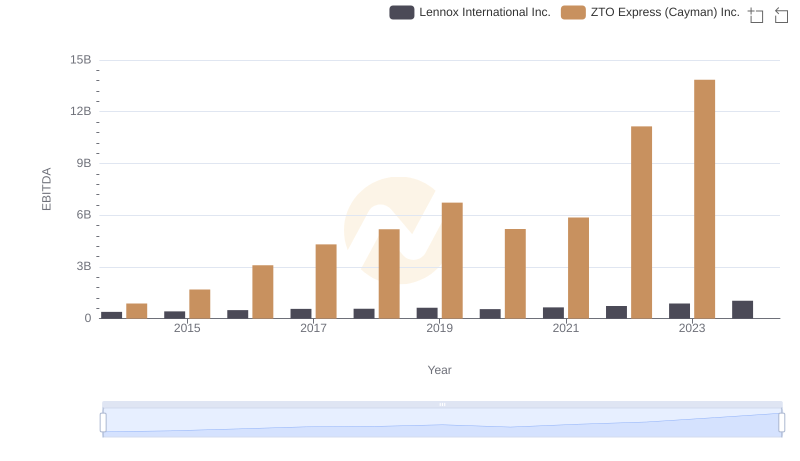
A Professional Review of EBITDA: Lennox International Inc. Compared to ZTO Express (Cayman) Inc.
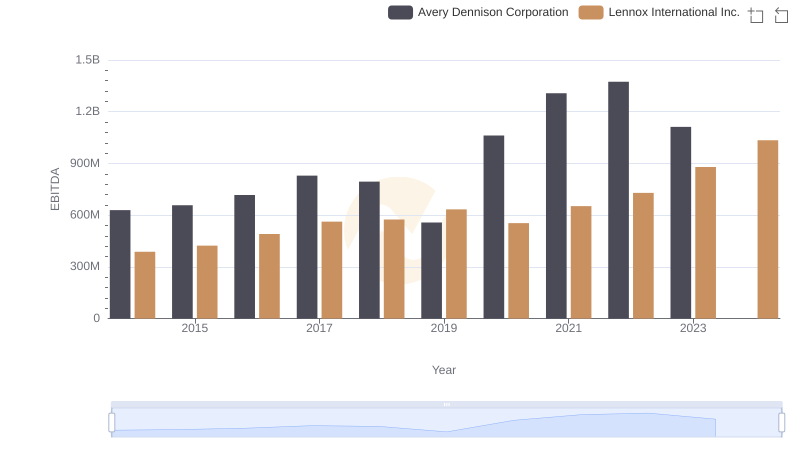
A Professional Review of EBITDA: Lennox International Inc. Compared to Avery Dennison Corporation