| __timestamp | Lennox International Inc. | Textron Inc. |
|---|---|---|
| Wednesday, January 1, 2014 | 3367400000 | 13878000000 |
| Thursday, January 1, 2015 | 3467400000 | 13423000000 |
| Friday, January 1, 2016 | 3641600000 | 13788000000 |
| Sunday, January 1, 2017 | 3839600000 | 14198000000 |
| Monday, January 1, 2018 | 3883900000 | 13972000000 |
| Tuesday, January 1, 2019 | 3807200000 | 13630000000 |
| Wednesday, January 1, 2020 | 3634100000 | 11651000000 |
| Friday, January 1, 2021 | 4194100000 | 12382000000 |
| Saturday, January 1, 2022 | 4718400000 | 12869000000 |
| Sunday, January 1, 2023 | 4981900000 | 13683000000 |
| Monday, January 1, 2024 | 5341300000 | 13702000000 |
Unlocking the unknown
In the ever-evolving landscape of industrial giants, Lennox International Inc. and Textron Inc. have carved distinct paths over the past decade. From 2014 to 2024, Lennox International has demonstrated a robust revenue growth of approximately 59%, surging from $3.37 billion to $5.34 billion. This impressive trajectory highlights Lennox's strategic prowess in navigating market challenges and capitalizing on opportunities.
Conversely, Textron Inc. has experienced a more modest revenue fluctuation, with a slight decline of about 1% over the same period. Starting at $13.88 billion in 2014, Textron's revenue dipped to $13.70 billion by 2024, reflecting the company's resilience amidst industry headwinds.
This comparative analysis underscores the dynamic nature of the industrial sector, where strategic agility and market adaptation are key to sustained growth. As these two titans continue to evolve, their financial narratives offer valuable insights into the broader economic landscape.
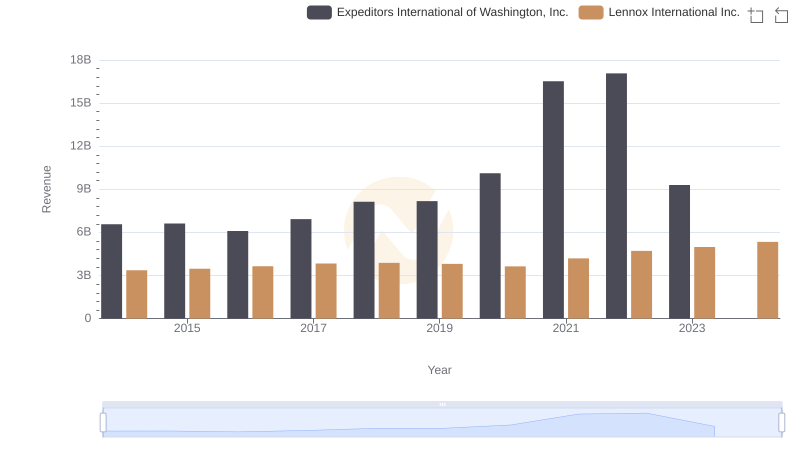
Lennox International Inc. vs Expeditors International of Washington, Inc.: Examining Key Revenue Metrics
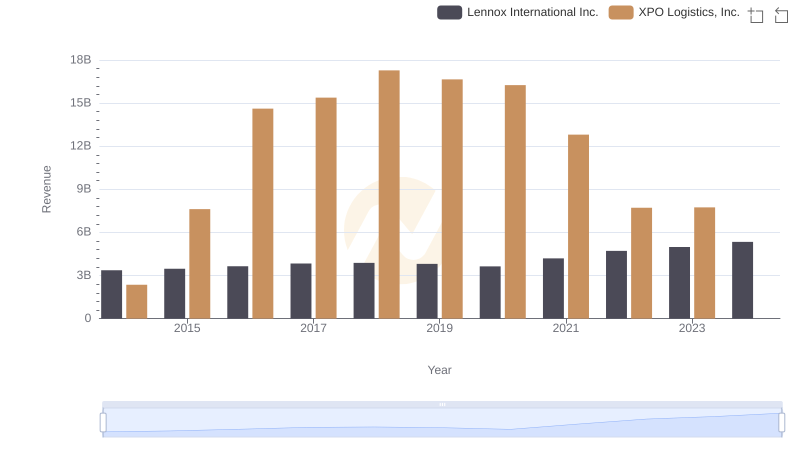
Revenue Showdown: Lennox International Inc. vs XPO Logistics, Inc.
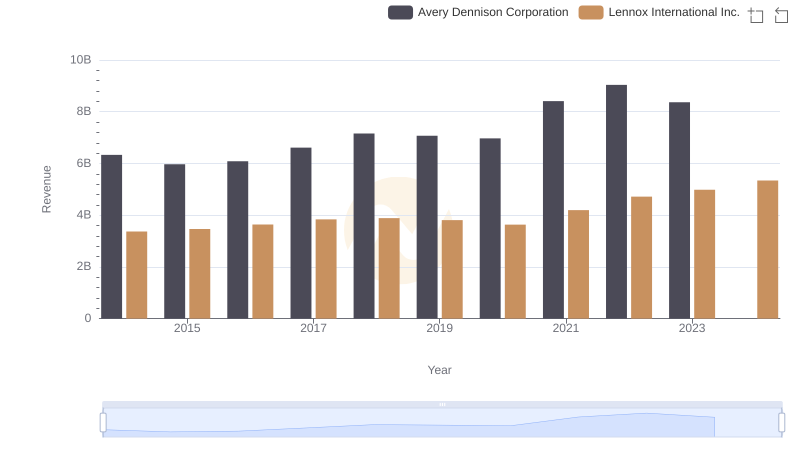
Lennox International Inc. and Avery Dennison Corporation: A Comprehensive Revenue Analysis
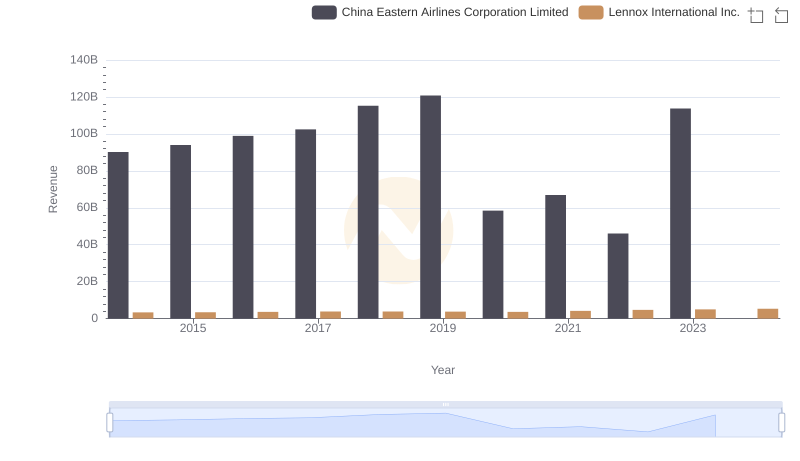
Revenue Insights: Lennox International Inc. and China Eastern Airlines Corporation Limited Performance Compared
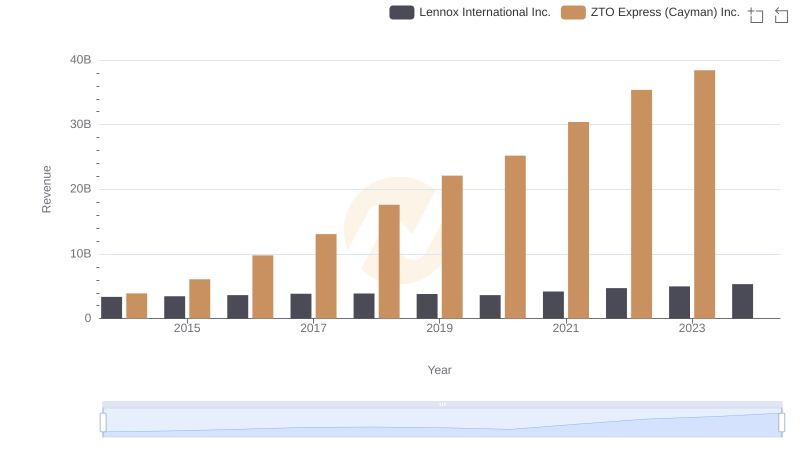
Lennox International Inc. and ZTO Express (Cayman) Inc.: A Comprehensive Revenue Analysis
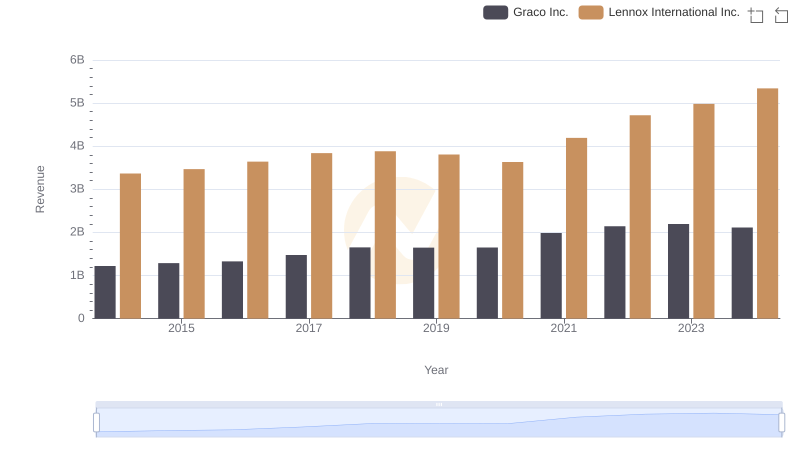
Revenue Showdown: Lennox International Inc. vs Graco Inc.
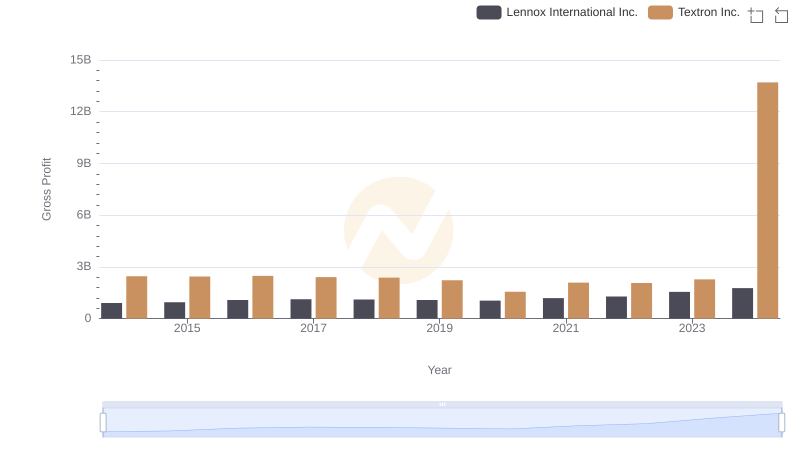
Gross Profit Comparison: Lennox International Inc. and Textron Inc. Trends
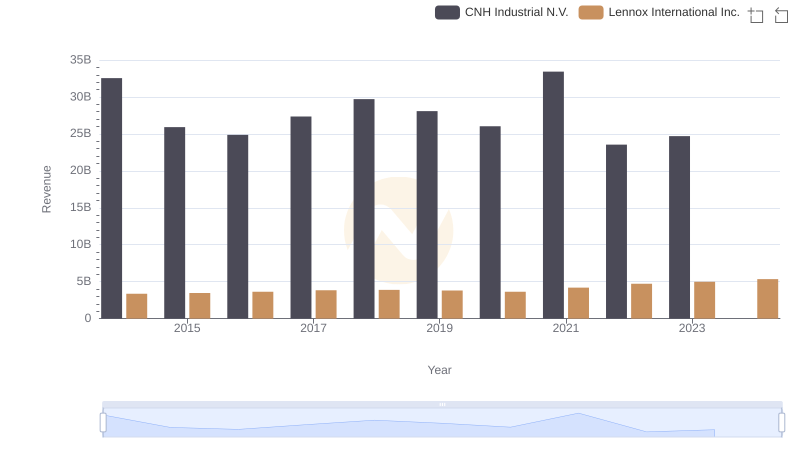
Lennox International Inc. and CNH Industrial N.V.: A Comprehensive Revenue Analysis
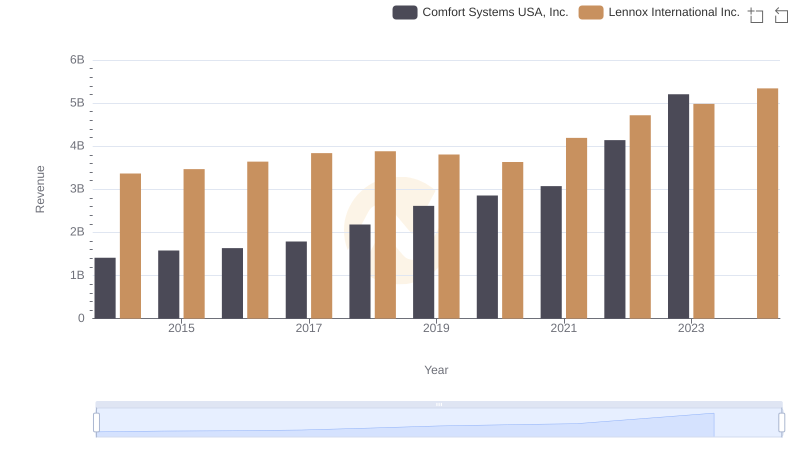
Lennox International Inc. vs Comfort Systems USA, Inc.: Annual Revenue Growth Compared
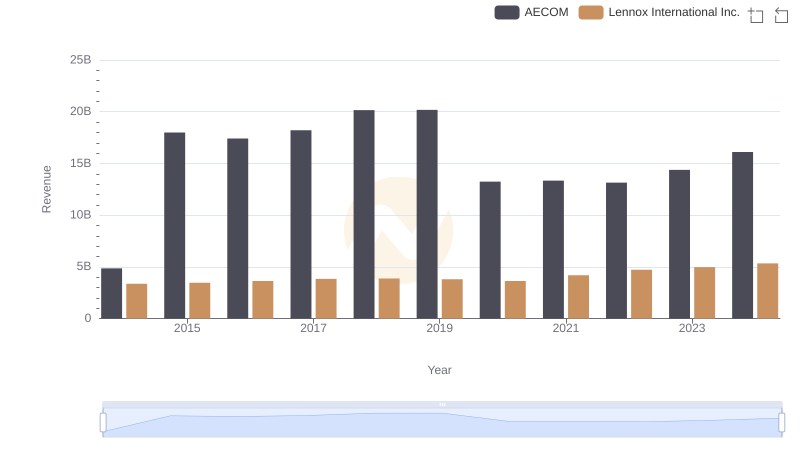
Lennox International Inc. vs AECOM: Examining Key Revenue Metrics
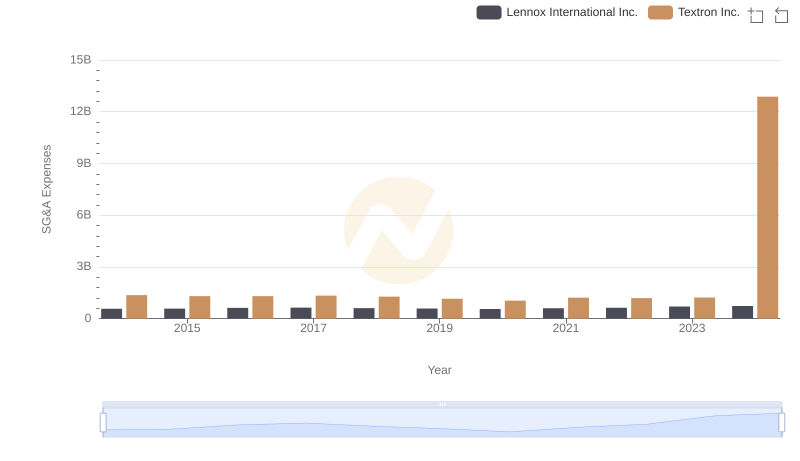
Lennox International Inc. or Textron Inc.: Who Manages SG&A Costs Better?
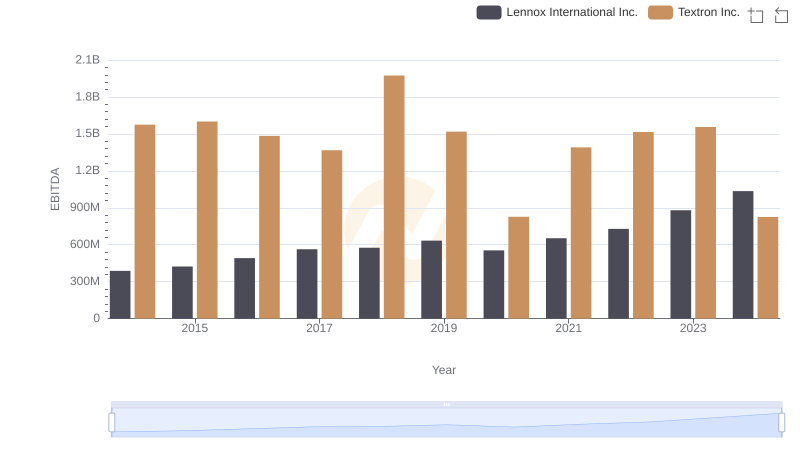
EBITDA Performance Review: Lennox International Inc. vs Textron Inc.