| __timestamp | Carlisle Companies Incorporated | Lennox International Inc. |
|---|---|---|
| Wednesday, January 1, 2014 | 512300000 | 387700000 |
| Thursday, January 1, 2015 | 631900000 | 423600000 |
| Friday, January 1, 2016 | 580200000 | 490800000 |
| Sunday, January 1, 2017 | 609300000 | 562900000 |
| Monday, January 1, 2018 | 696100000 | 575200000 |
| Tuesday, January 1, 2019 | 851000000 | 633300000 |
| Wednesday, January 1, 2020 | 733100000 | 553900000 |
| Friday, January 1, 2021 | 816100000 | 652500000 |
| Saturday, January 1, 2022 | 1483400000 | 729000000 |
| Sunday, January 1, 2023 | 1210700000 | 879500000 |
| Monday, January 1, 2024 | 1356800000 | 1034800000 |
Unlocking the unknown
In the ever-evolving landscape of industrial manufacturing, Lennox International Inc. and Carlisle Companies Incorporated have emerged as key players. Over the past decade, from 2014 to 2023, these companies have demonstrated significant growth in their EBITDA, a crucial indicator of financial performance. Carlisle Companies Incorporated has shown a remarkable increase of approximately 136% in EBITDA, peaking in 2022. Meanwhile, Lennox International Inc. has steadily grown by around 168%, reaching its highest EBITDA in 2023. This growth trajectory highlights the resilience and strategic prowess of both companies in navigating market challenges. Notably, the data for 2024 is incomplete, indicating a potential area for future analysis. As these companies continue to innovate and expand, their financial performance will be a critical area of interest for investors and industry analysts alike.
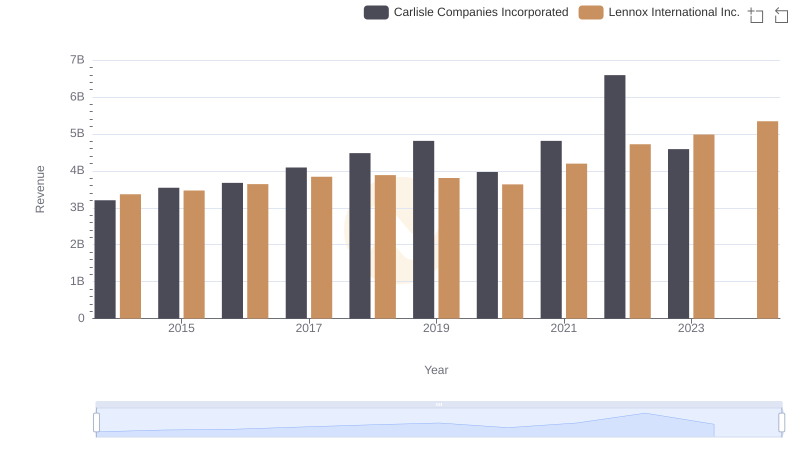
Lennox International Inc. or Carlisle Companies Incorporated: Who Leads in Yearly Revenue?
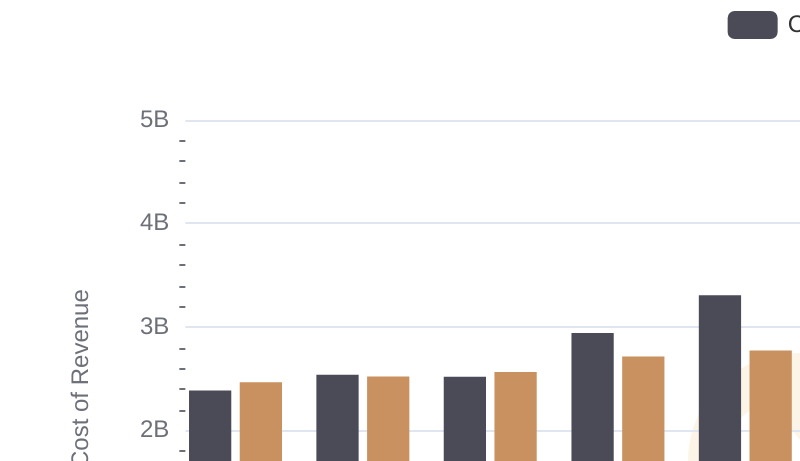
Comparing Cost of Revenue Efficiency: Lennox International Inc. vs Carlisle Companies Incorporated
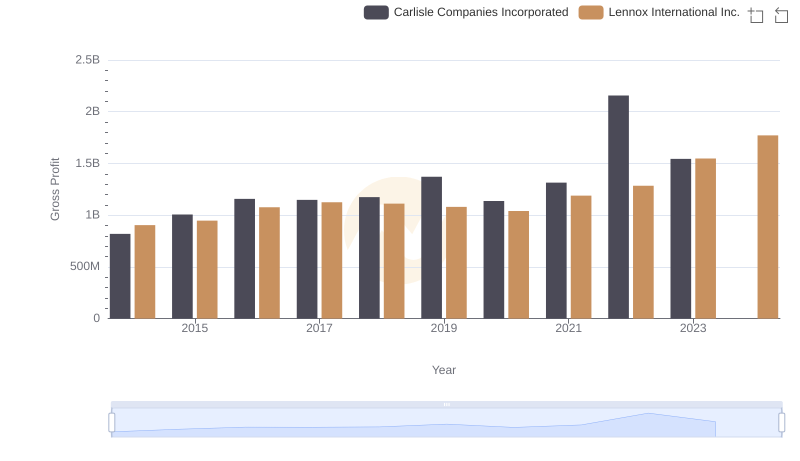
Gross Profit Trends Compared: Lennox International Inc. vs Carlisle Companies Incorporated
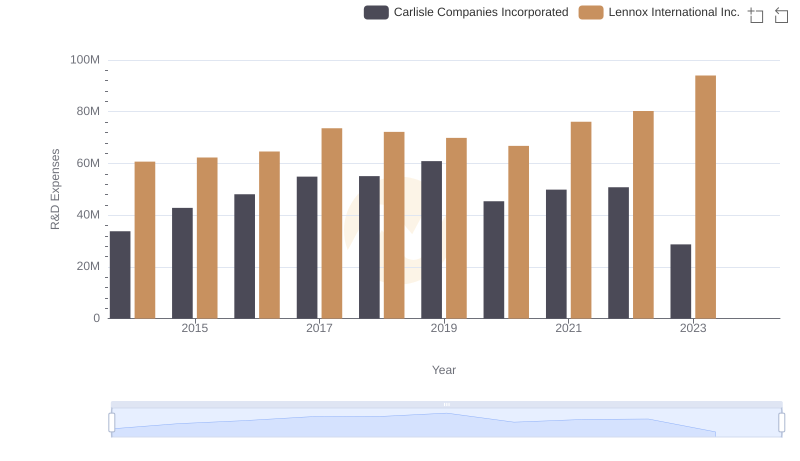
Analyzing R&D Budgets: Lennox International Inc. vs Carlisle Companies Incorporated
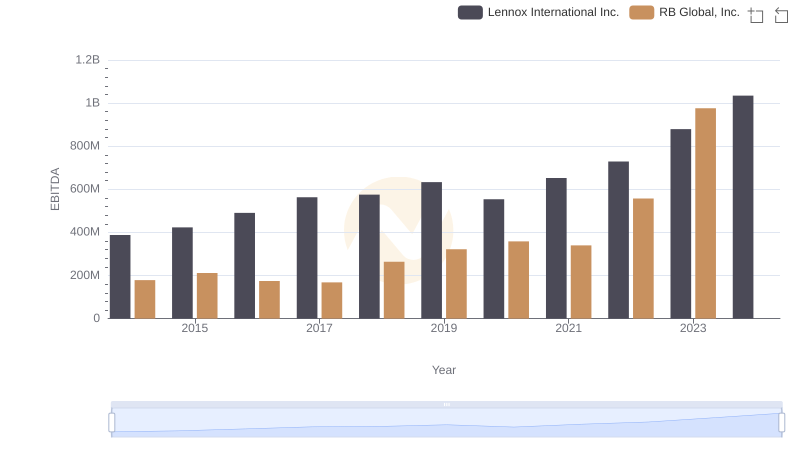
Lennox International Inc. and RB Global, Inc.: A Detailed Examination of EBITDA Performance
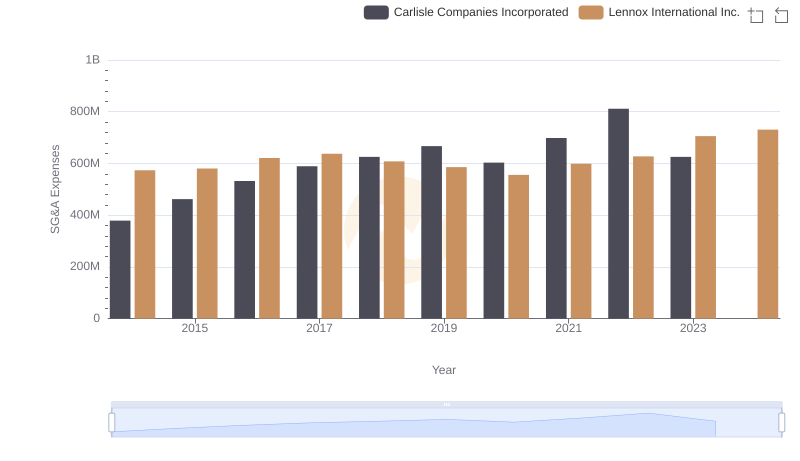
Selling, General, and Administrative Costs: Lennox International Inc. vs Carlisle Companies Incorporated
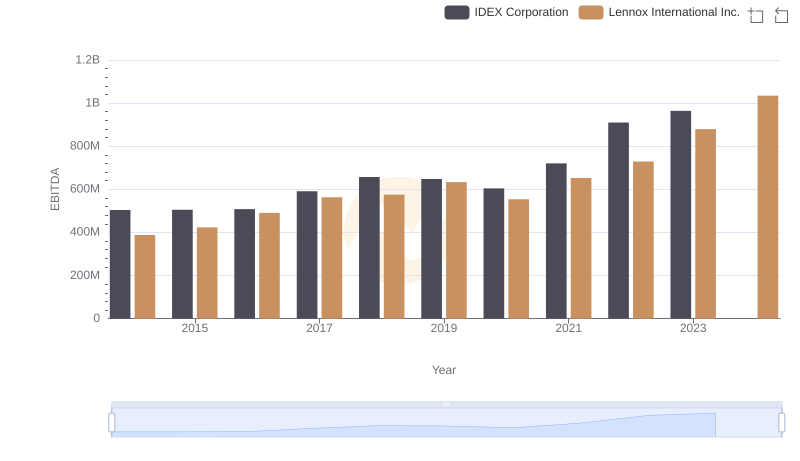
A Professional Review of EBITDA: Lennox International Inc. Compared to IDEX Corporation
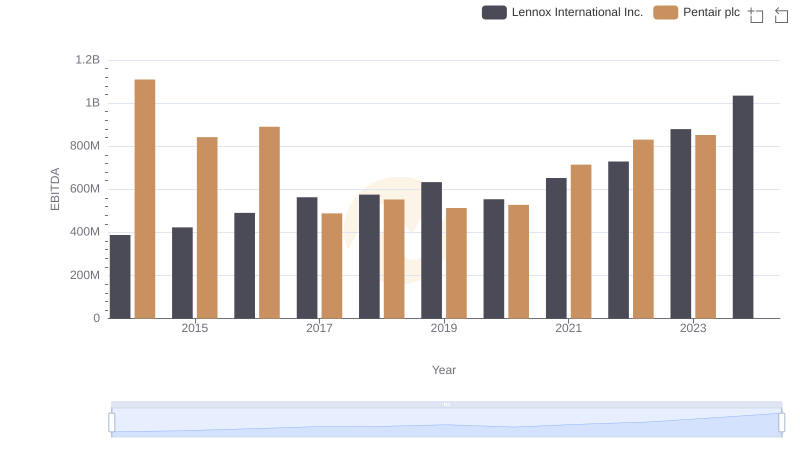
Comparative EBITDA Analysis: Lennox International Inc. vs Pentair plc
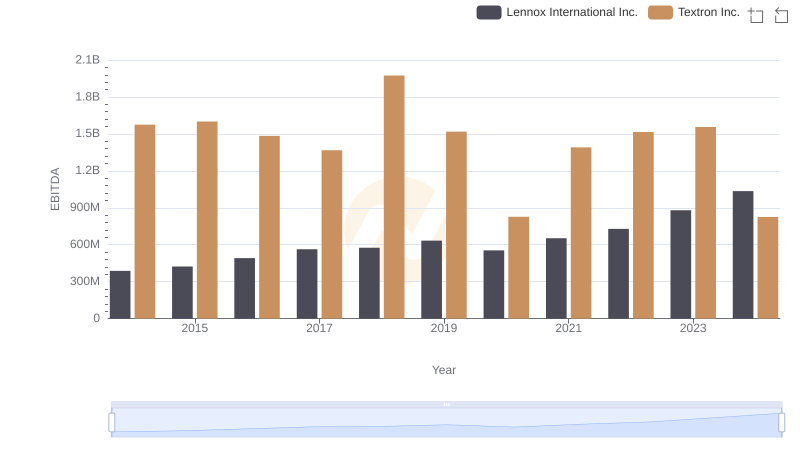
EBITDA Performance Review: Lennox International Inc. vs Textron Inc.
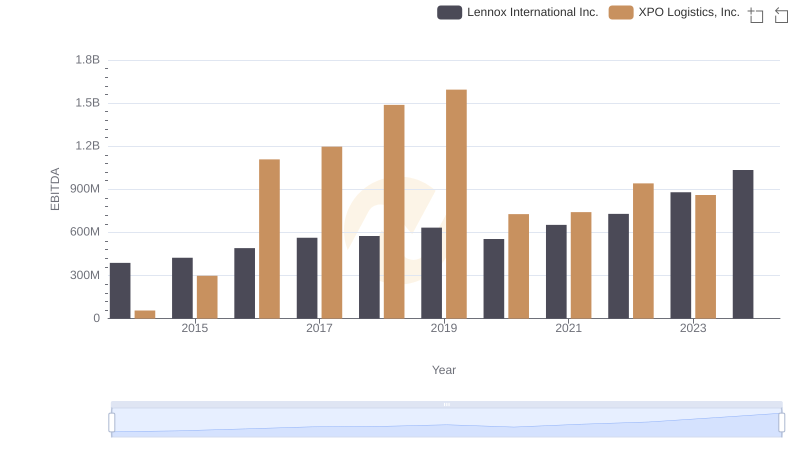
A Professional Review of EBITDA: Lennox International Inc. Compared to XPO Logistics, Inc.
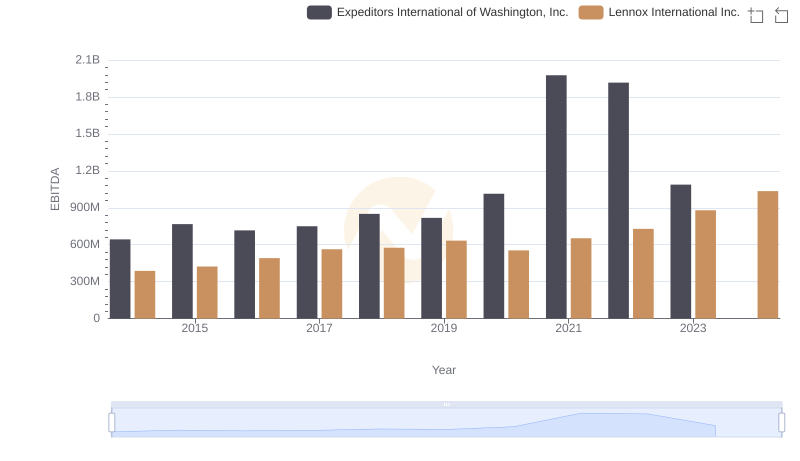
Lennox International Inc. and Expeditors International of Washington, Inc.: A Detailed Examination of EBITDA Performance
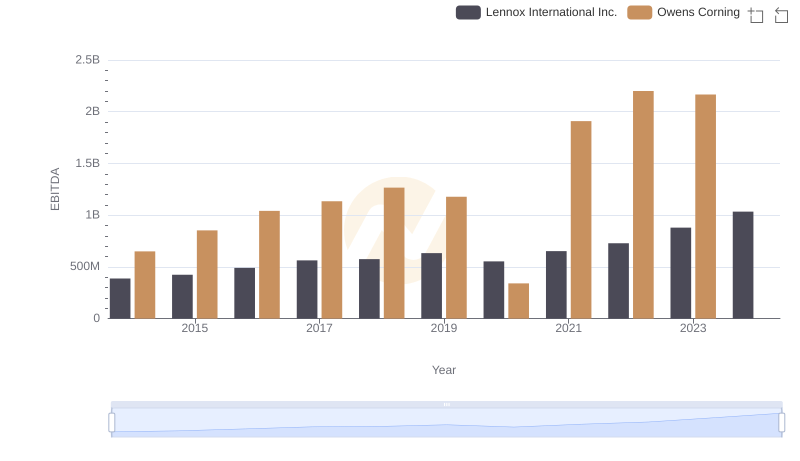
Comparative EBITDA Analysis: Lennox International Inc. vs Owens Corning