| __timestamp | Lennox International Inc. | Owens Corning |
|---|---|---|
| Wednesday, January 1, 2014 | 387700000 | 650000000 |
| Thursday, January 1, 2015 | 423600000 | 853000000 |
| Friday, January 1, 2016 | 490800000 | 1041000000 |
| Sunday, January 1, 2017 | 562900000 | 1134000000 |
| Monday, January 1, 2018 | 575200000 | 1266000000 |
| Tuesday, January 1, 2019 | 633300000 | 1178000000 |
| Wednesday, January 1, 2020 | 553900000 | 341000000 |
| Friday, January 1, 2021 | 652500000 | 1909000000 |
| Saturday, January 1, 2022 | 729000000 | 2200000000 |
| Sunday, January 1, 2023 | 879500000 | 2166000000 |
| Monday, January 1, 2024 | 1034800000 |
Cracking the code
In the competitive landscape of the HVAC and building materials industries, Lennox International Inc. and Owens Corning have demonstrated remarkable EBITDA growth over the past decade. From 2014 to 2023, Lennox International Inc. saw its EBITDA increase by approximately 167%, starting from 39% of Owens Corning's EBITDA in 2014 to nearly 48% in 2023. Meanwhile, Owens Corning's EBITDA surged by 233% during the same period, showcasing its robust market position.
The year 2020 marked a challenging period for both companies, with Lennox experiencing a 12% dip in EBITDA, while Owens Corning faced a significant 71% drop. However, both companies rebounded strongly in the subsequent years, with Owens Corning achieving its peak EBITDA in 2022. Notably, data for Owens Corning in 2024 is missing, leaving room for speculation on its future trajectory. This comparative analysis highlights the resilience and strategic growth of these industry leaders.
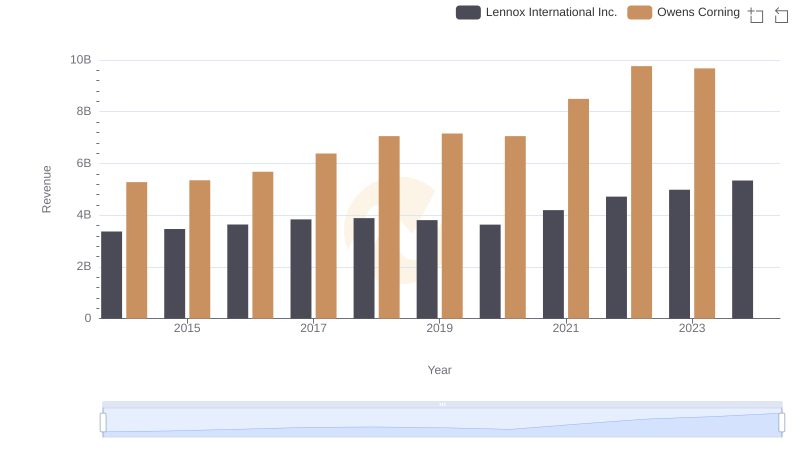
Lennox International Inc. and Owens Corning: A Comprehensive Revenue Analysis
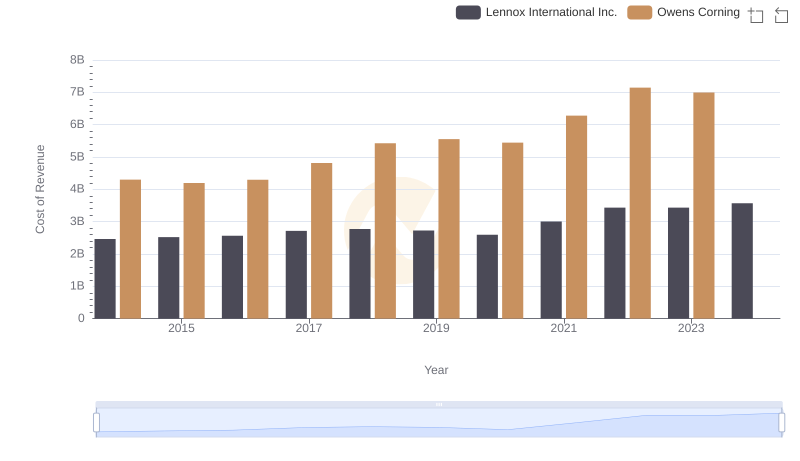
Cost Insights: Breaking Down Lennox International Inc. and Owens Corning's Expenses
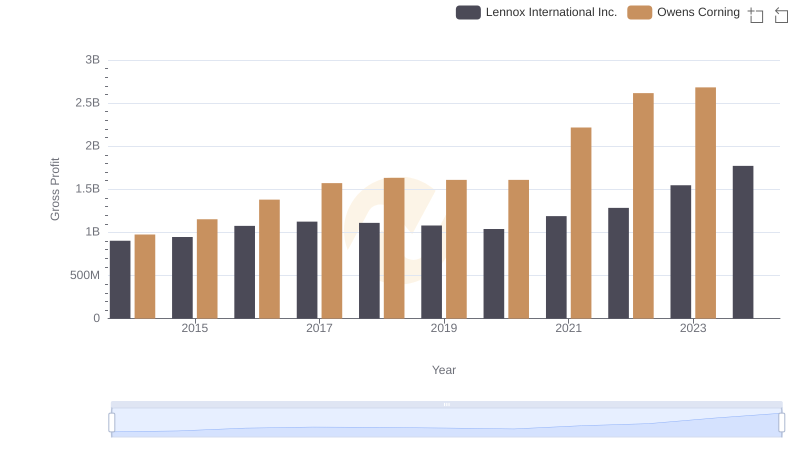
Gross Profit Analysis: Comparing Lennox International Inc. and Owens Corning
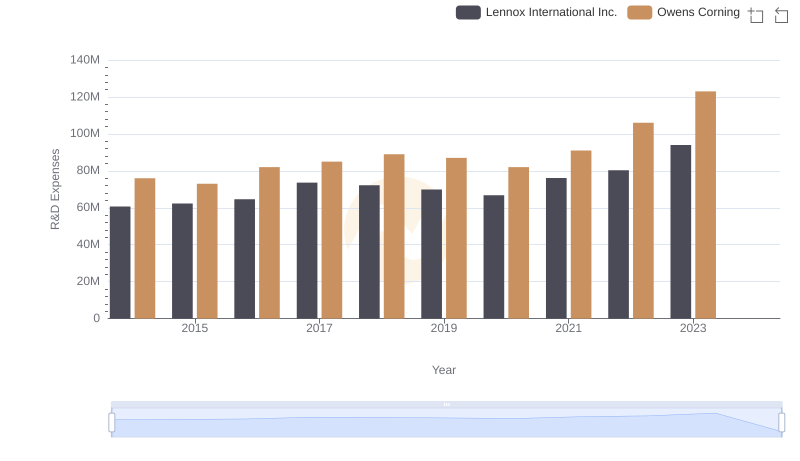
Research and Development: Comparing Key Metrics for Lennox International Inc. and Owens Corning
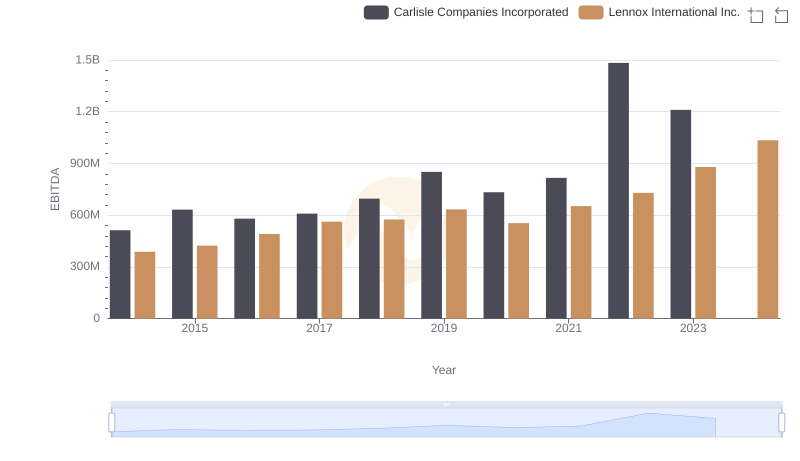
A Side-by-Side Analysis of EBITDA: Lennox International Inc. and Carlisle Companies Incorporated
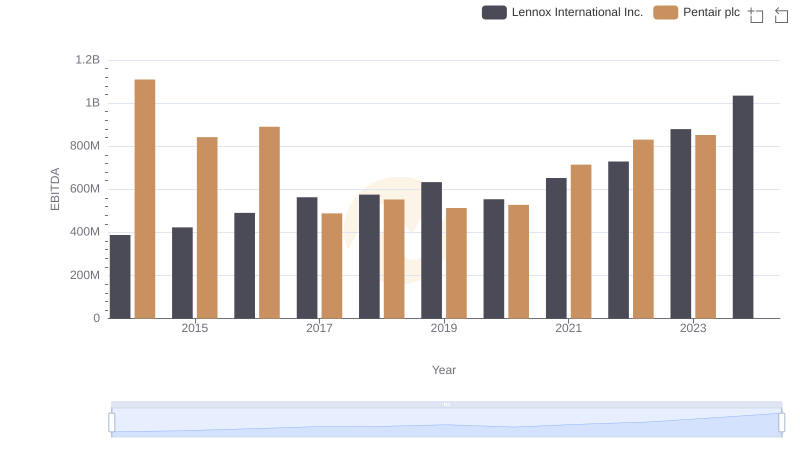
Comparative EBITDA Analysis: Lennox International Inc. vs Pentair plc
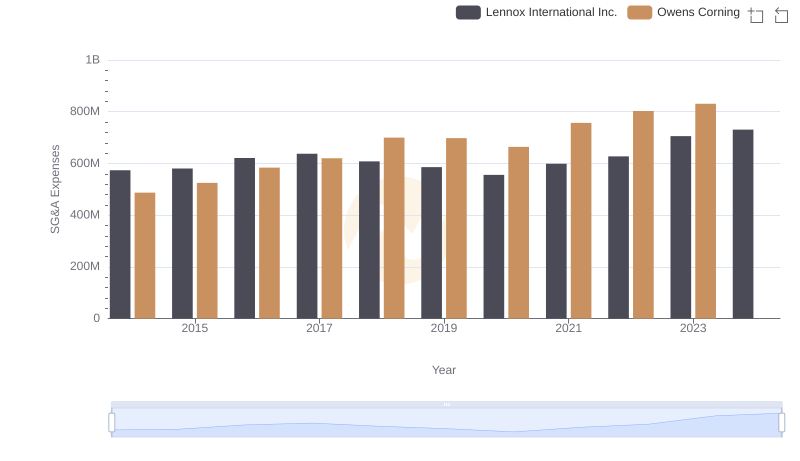
Lennox International Inc. or Owens Corning: Who Manages SG&A Costs Better?
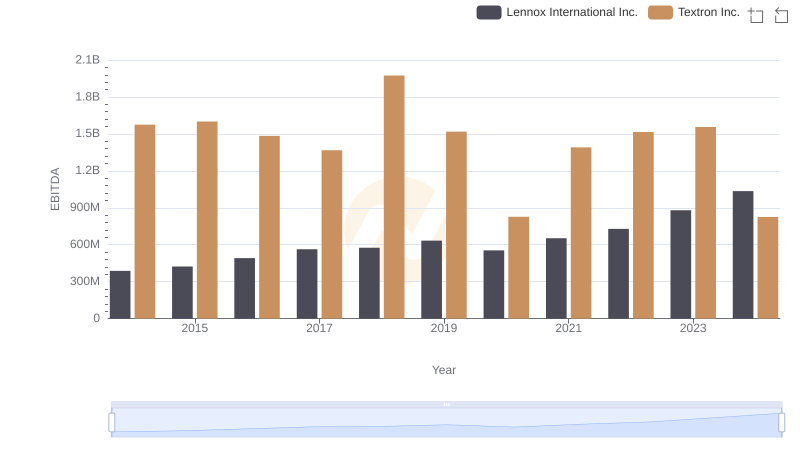
EBITDA Performance Review: Lennox International Inc. vs Textron Inc.
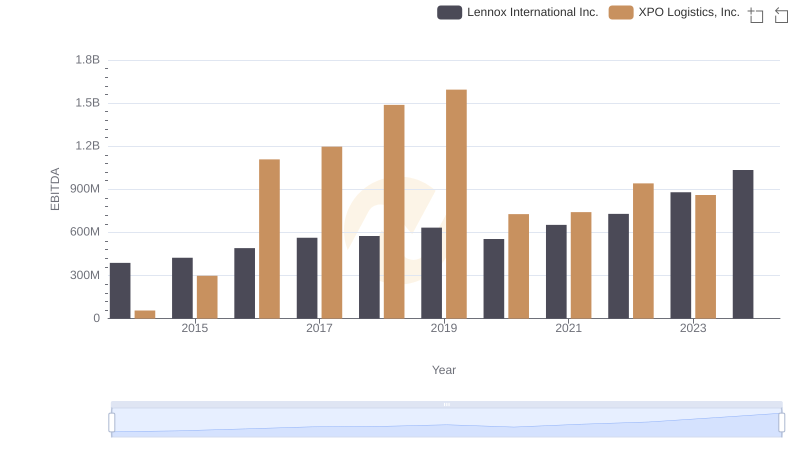
A Professional Review of EBITDA: Lennox International Inc. Compared to XPO Logistics, Inc.
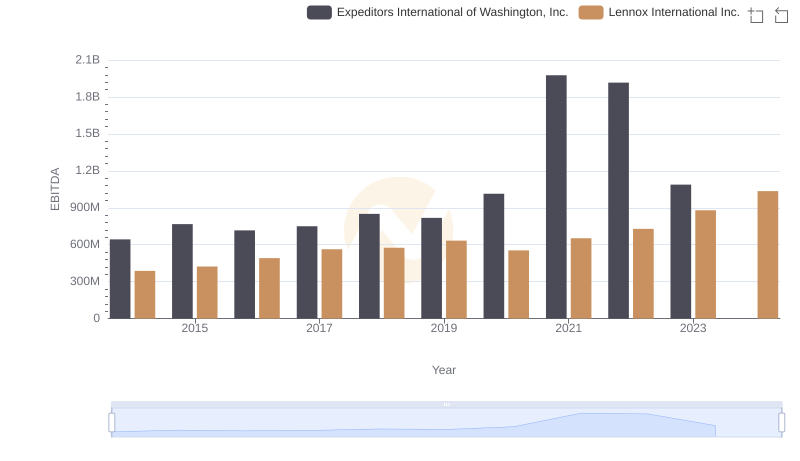
Lennox International Inc. and Expeditors International of Washington, Inc.: A Detailed Examination of EBITDA Performance
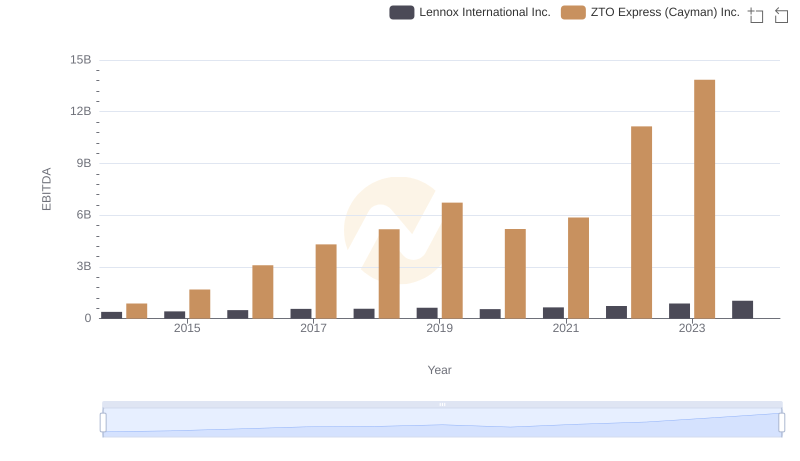
A Professional Review of EBITDA: Lennox International Inc. Compared to ZTO Express (Cayman) Inc.
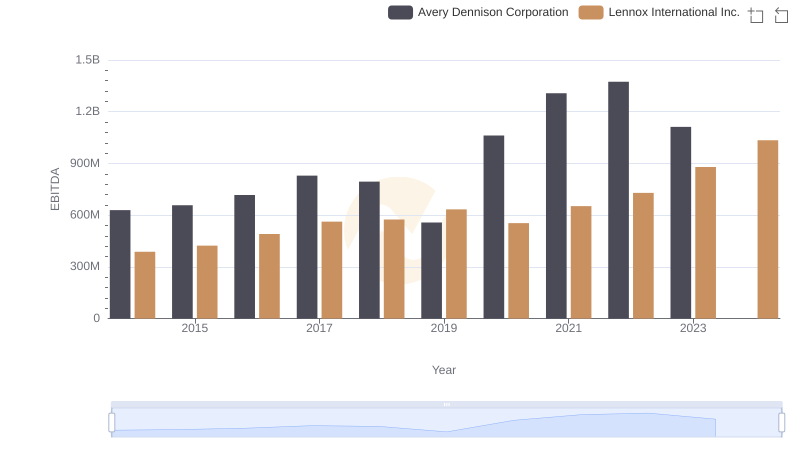
A Professional Review of EBITDA: Lennox International Inc. Compared to Avery Dennison Corporation