| __timestamp | Lennox International Inc. | Pentair plc |
|---|---|---|
| Wednesday, January 1, 2014 | 387700000 | 1109300000 |
| Thursday, January 1, 2015 | 423600000 | 842400000 |
| Friday, January 1, 2016 | 490800000 | 890400000 |
| Sunday, January 1, 2017 | 562900000 | 488600000 |
| Monday, January 1, 2018 | 575200000 | 552800000 |
| Tuesday, January 1, 2019 | 633300000 | 513200000 |
| Wednesday, January 1, 2020 | 553900000 | 527600000 |
| Friday, January 1, 2021 | 652500000 | 714400000 |
| Saturday, January 1, 2022 | 729000000 | 830400000 |
| Sunday, January 1, 2023 | 879500000 | 852000000 |
| Monday, January 1, 2024 | 1034800000 | 803800000 |
Unleashing the power of data
In the ever-evolving landscape of the HVAC and water solutions industries, Lennox International Inc. and Pentair plc have been pivotal players. Over the past decade, Lennox International has demonstrated a remarkable growth trajectory, with its EBITDA increasing by approximately 167% from 2014 to 2023. This growth underscores Lennox's strategic initiatives and market adaptability.
Conversely, Pentair plc, while experiencing fluctuations, has shown resilience, with its EBITDA peaking in 2014 and maintaining a steady performance thereafter. Notably, Pentair's EBITDA in 2023 was slightly lower than Lennox's, marking a shift in competitive dynamics.
The data from 2024 remains incomplete, highlighting the need for ongoing analysis. As these companies continue to innovate, stakeholders and investors should keep a keen eye on their financial health and strategic directions.
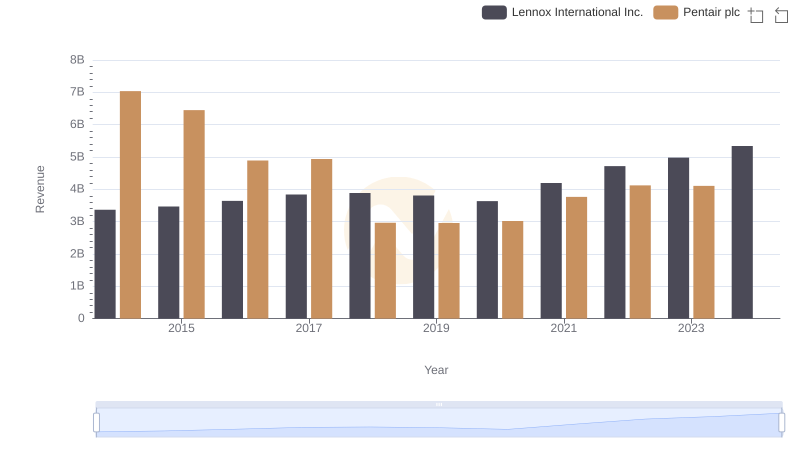
Lennox International Inc. and Pentair plc: A Comprehensive Revenue Analysis
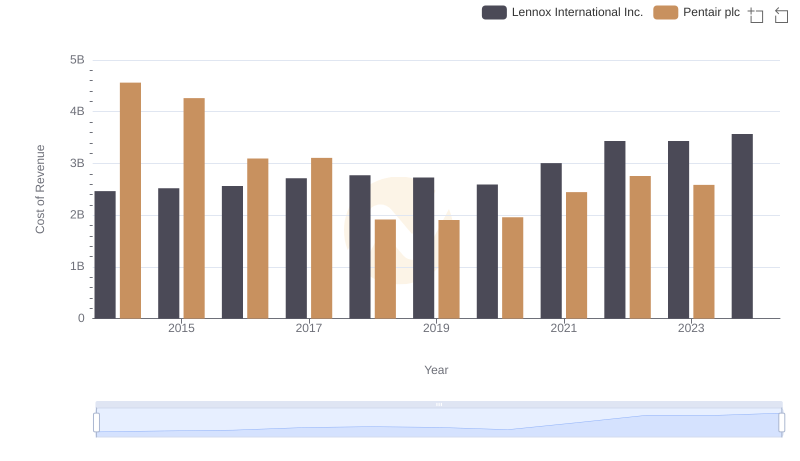
Cost Insights: Breaking Down Lennox International Inc. and Pentair plc's Expenses
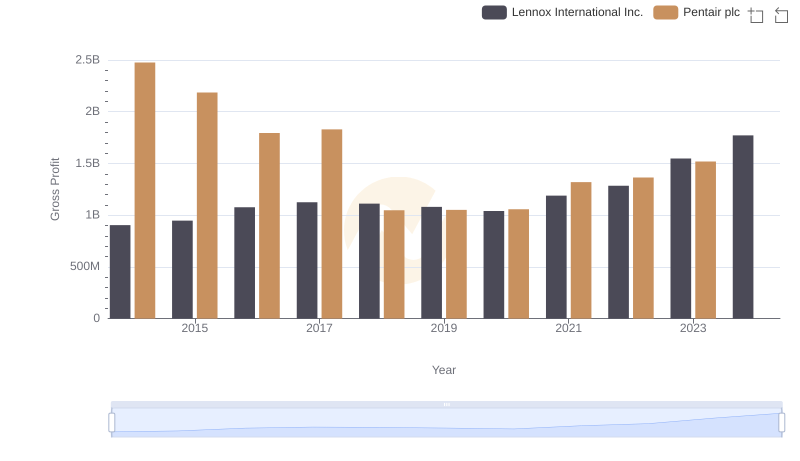
Gross Profit Analysis: Comparing Lennox International Inc. and Pentair plc
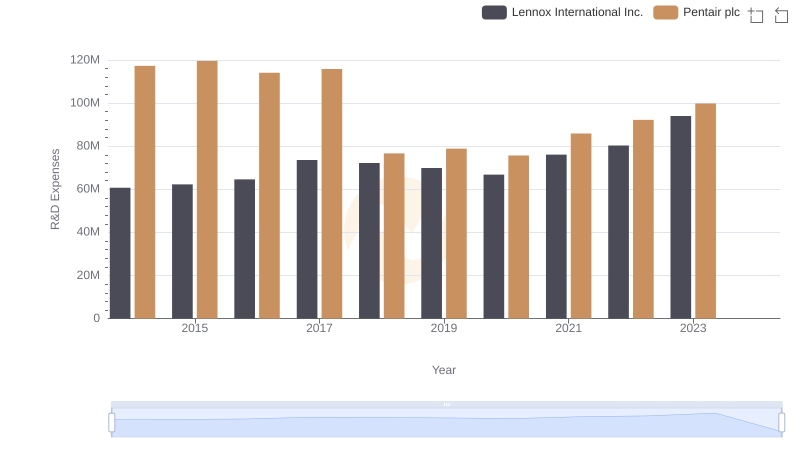
Lennox International Inc. vs Pentair plc: Strategic Focus on R&D Spending
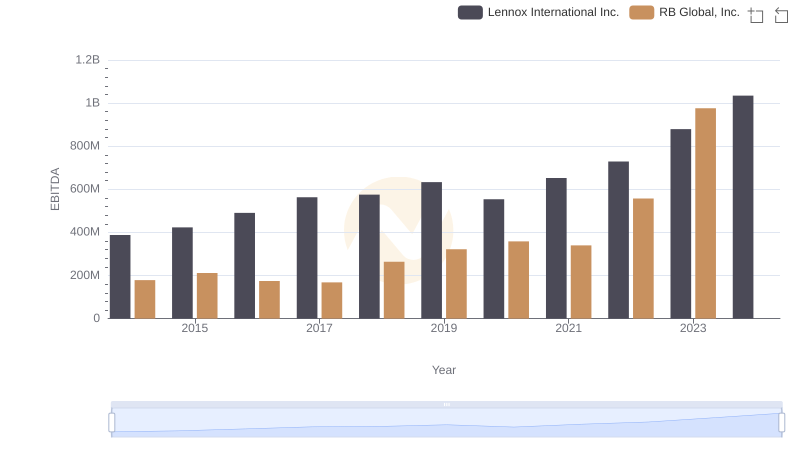
Lennox International Inc. and RB Global, Inc.: A Detailed Examination of EBITDA Performance
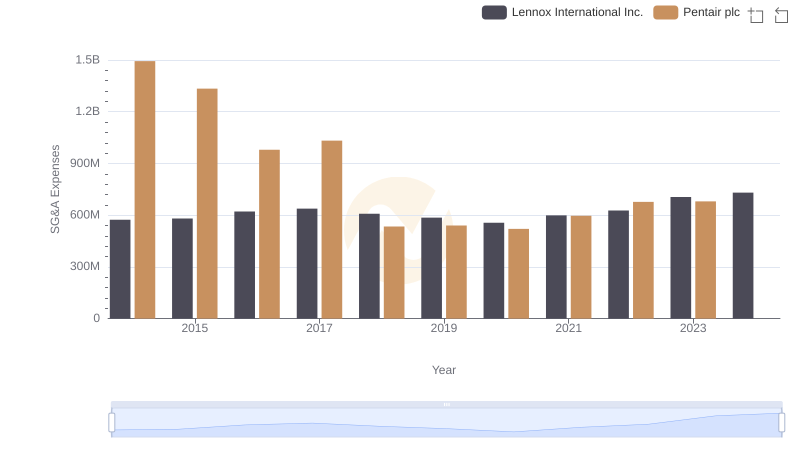
Lennox International Inc. and Pentair plc: SG&A Spending Patterns Compared
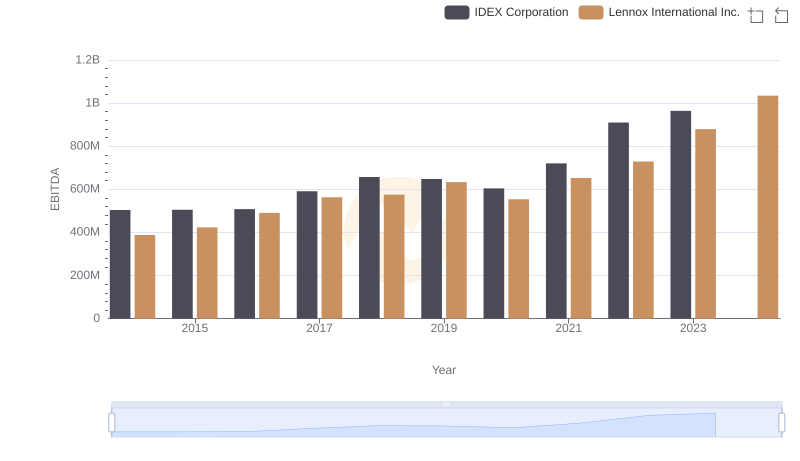
A Professional Review of EBITDA: Lennox International Inc. Compared to IDEX Corporation
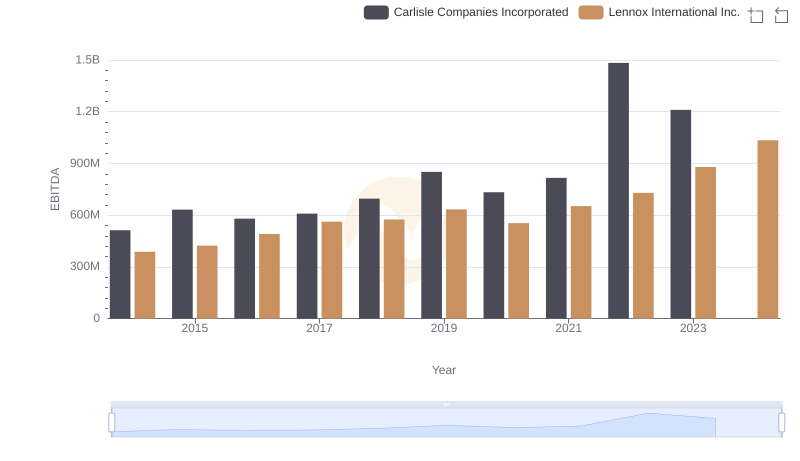
A Side-by-Side Analysis of EBITDA: Lennox International Inc. and Carlisle Companies Incorporated
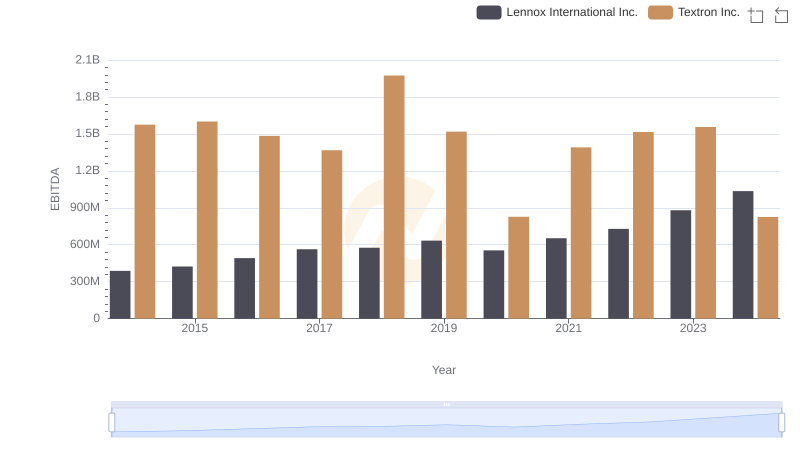
EBITDA Performance Review: Lennox International Inc. vs Textron Inc.
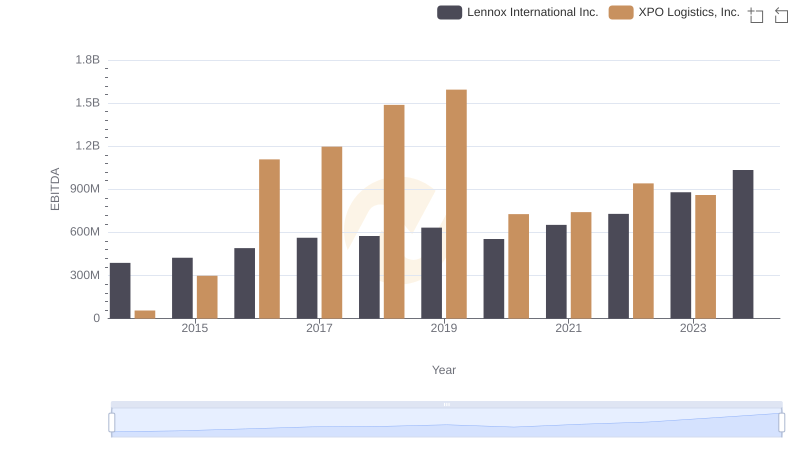
A Professional Review of EBITDA: Lennox International Inc. Compared to XPO Logistics, Inc.
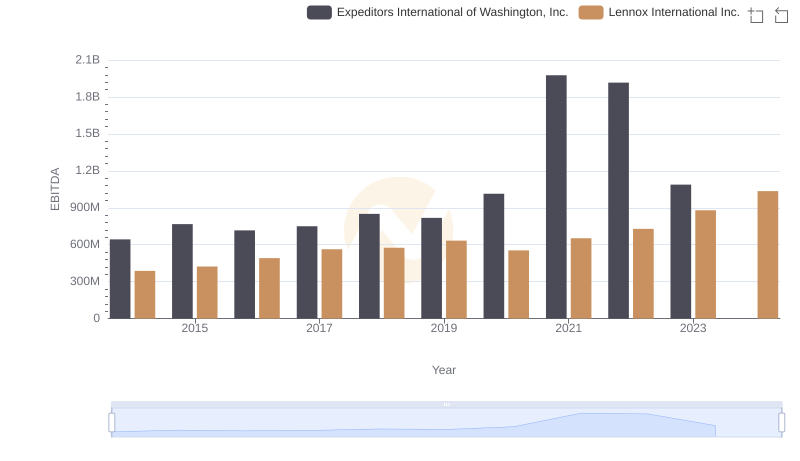
Lennox International Inc. and Expeditors International of Washington, Inc.: A Detailed Examination of EBITDA Performance
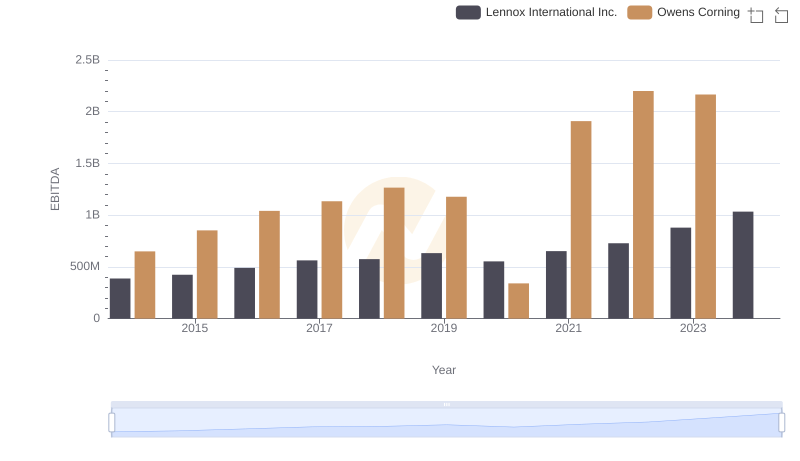
Comparative EBITDA Analysis: Lennox International Inc. vs Owens Corning