| __timestamp | Lennox International Inc. | XPO Logistics, Inc. |
|---|---|---|
| Wednesday, January 1, 2014 | 387700000 | 56600000 |
| Thursday, January 1, 2015 | 423600000 | 298000000 |
| Friday, January 1, 2016 | 490800000 | 1108300000 |
| Sunday, January 1, 2017 | 562900000 | 1196700000 |
| Monday, January 1, 2018 | 575200000 | 1488000000 |
| Tuesday, January 1, 2019 | 633300000 | 1594000000 |
| Wednesday, January 1, 2020 | 553900000 | 727000000 |
| Friday, January 1, 2021 | 652500000 | 741000000 |
| Saturday, January 1, 2022 | 729000000 | 941000000 |
| Sunday, January 1, 2023 | 879500000 | 860000000 |
| Monday, January 1, 2024 | 1034800000 | 1186000000 |
In pursuit of knowledge
In the ever-evolving landscape of industrial giants, Lennox International Inc. and XPO Logistics, Inc. have showcased intriguing financial trajectories over the past decade. From 2014 to 2023, Lennox International's EBITDA has seen a robust growth of approximately 167%, starting from $388 million and reaching over $1 billion by 2023. This consistent upward trend highlights Lennox's strategic prowess in maintaining operational efficiency and market adaptability.
Conversely, XPO Logistics experienced a more volatile journey. Their EBITDA skyrocketed by over 2,700% from 2014 to 2019, peaking at $1.6 billion. However, post-2019, XPO faced fluctuations, with a notable dip in 2020, reflecting the broader economic challenges. By 2023, XPO's EBITDA stabilized around $860 million, showcasing resilience amidst market uncertainties.
This comparative analysis underscores the dynamic nature of the industrial sector, where strategic agility and market responsiveness are key to sustained financial success.
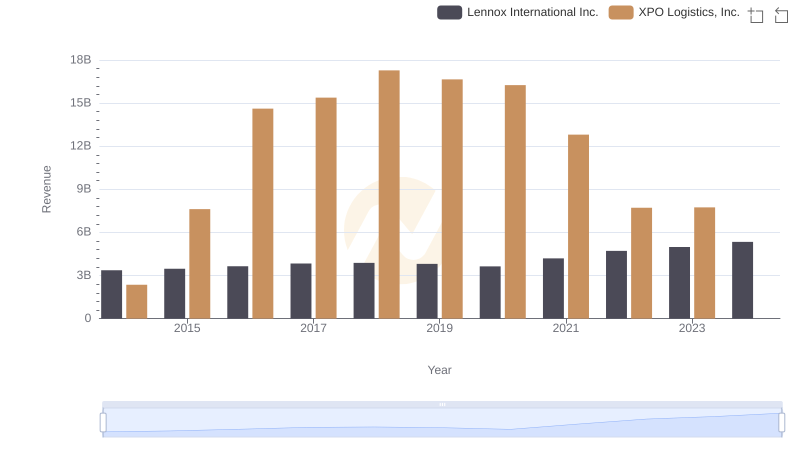
Revenue Showdown: Lennox International Inc. vs XPO Logistics, Inc.
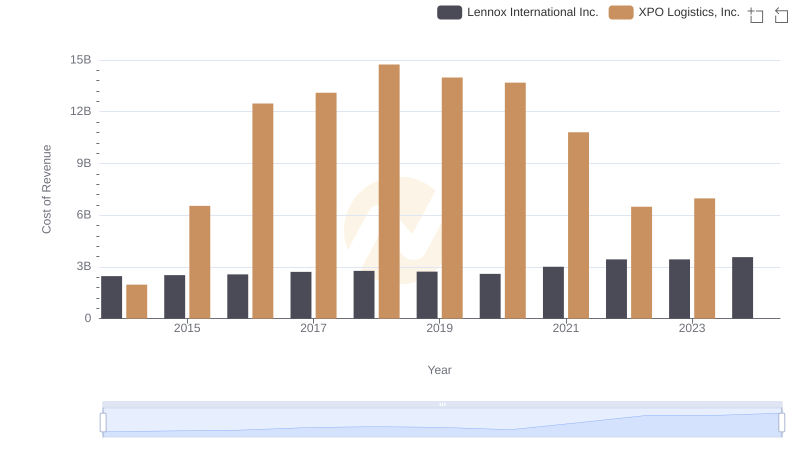
Lennox International Inc. vs XPO Logistics, Inc.: Efficiency in Cost of Revenue Explored
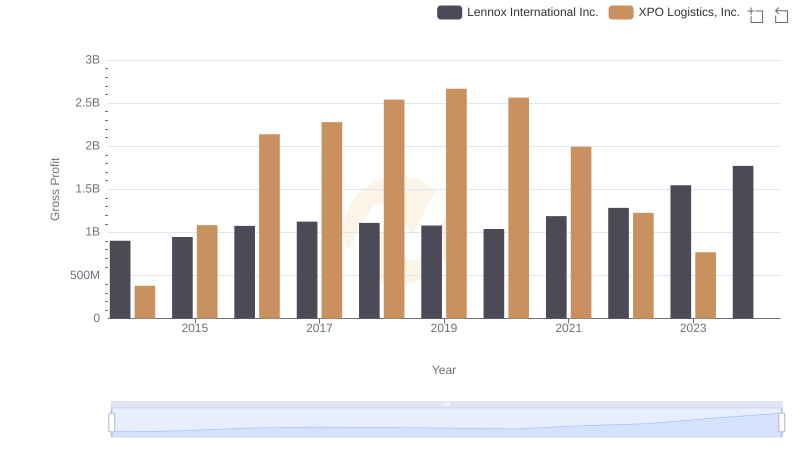
Gross Profit Comparison: Lennox International Inc. and XPO Logistics, Inc. Trends
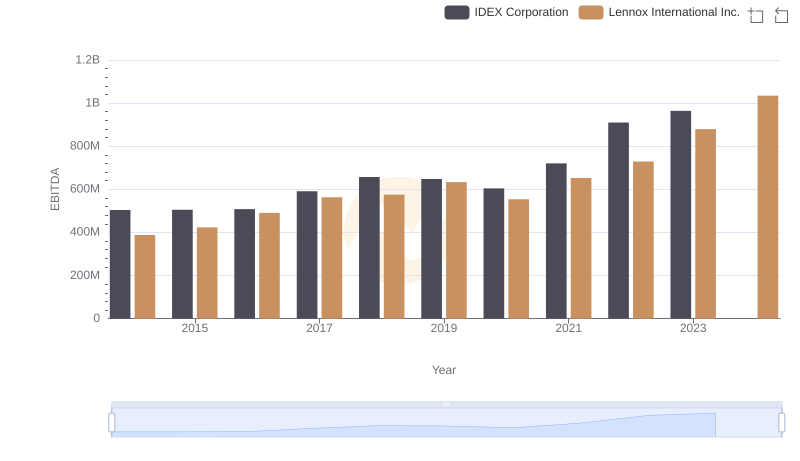
A Professional Review of EBITDA: Lennox International Inc. Compared to IDEX Corporation
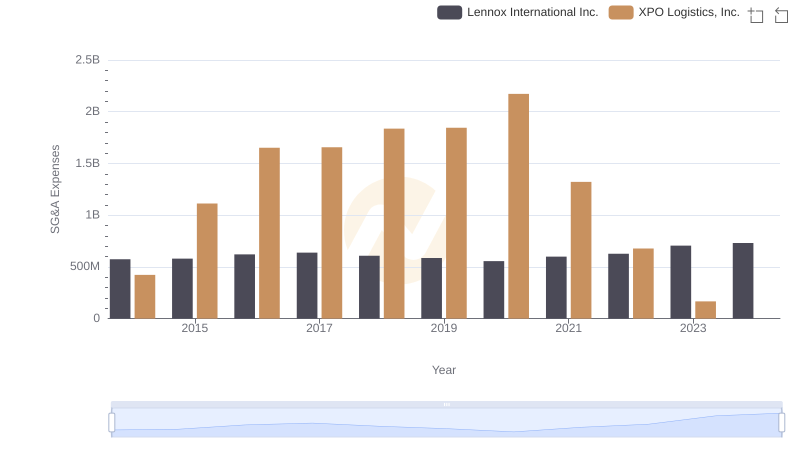
Lennox International Inc. vs XPO Logistics, Inc.: SG&A Expense Trends
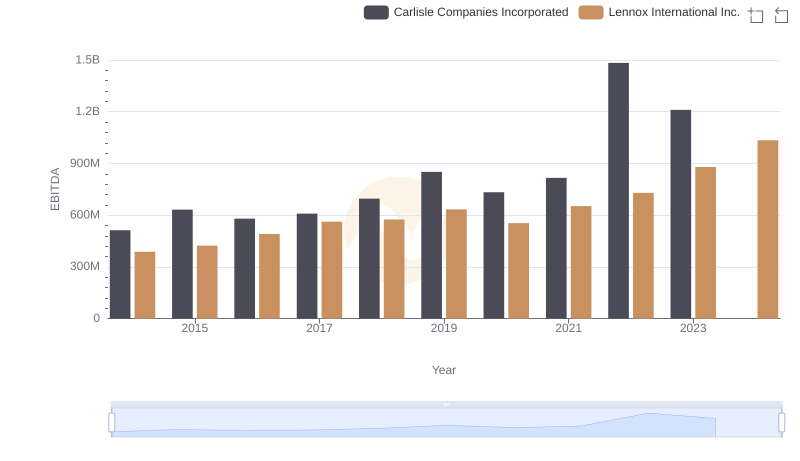
A Side-by-Side Analysis of EBITDA: Lennox International Inc. and Carlisle Companies Incorporated
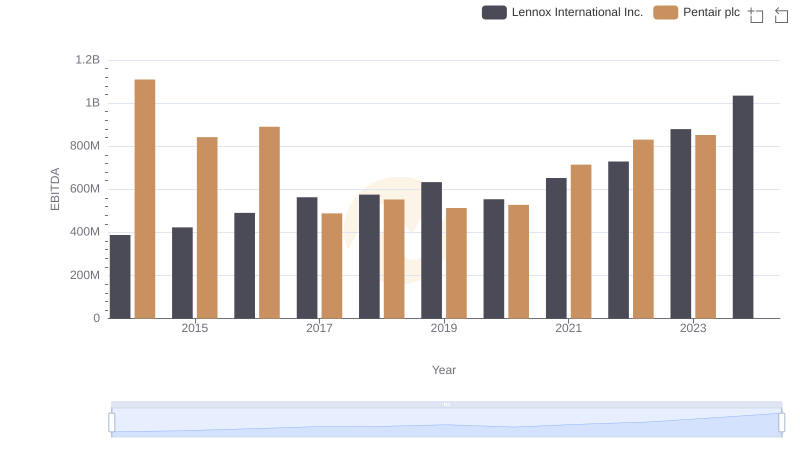
Comparative EBITDA Analysis: Lennox International Inc. vs Pentair plc
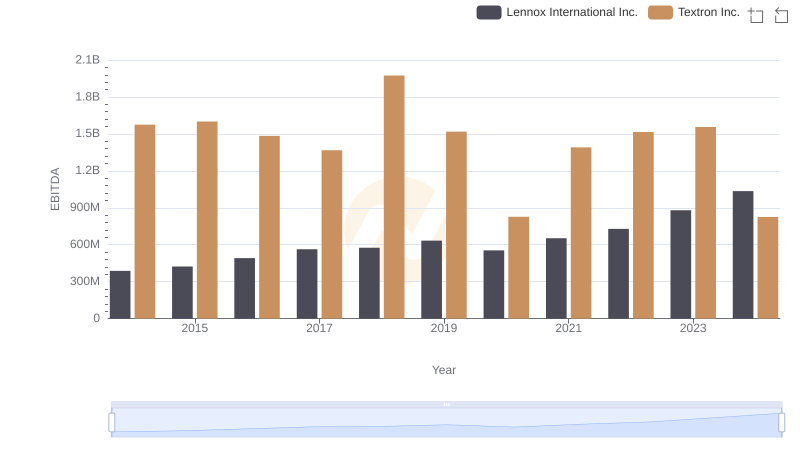
EBITDA Performance Review: Lennox International Inc. vs Textron Inc.
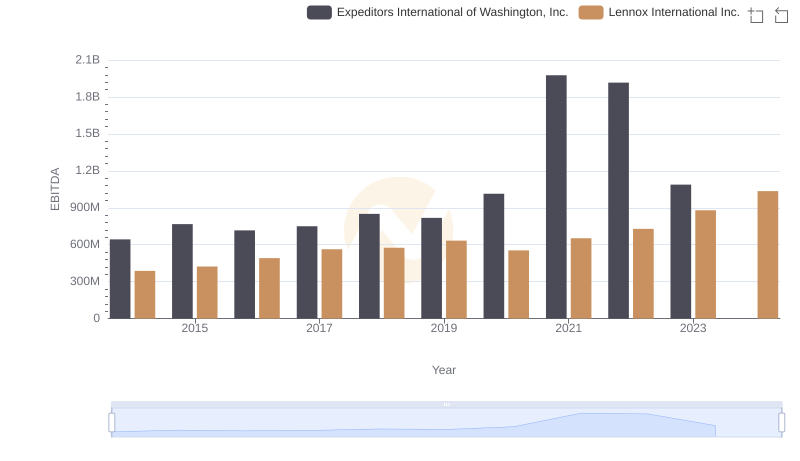
Lennox International Inc. and Expeditors International of Washington, Inc.: A Detailed Examination of EBITDA Performance
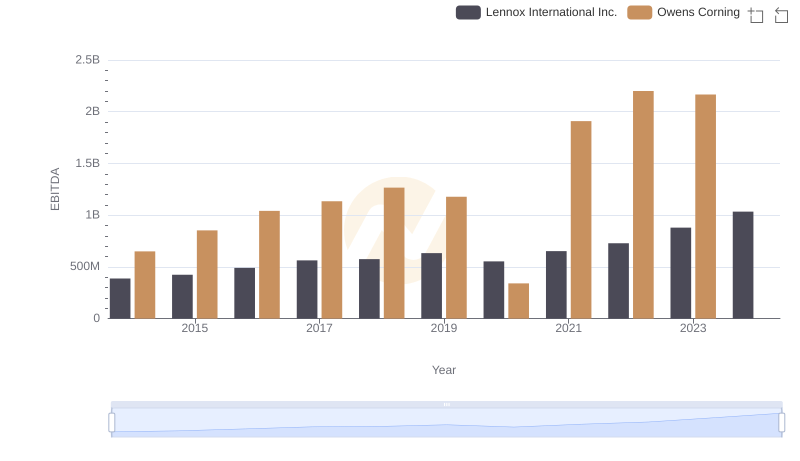
Comparative EBITDA Analysis: Lennox International Inc. vs Owens Corning
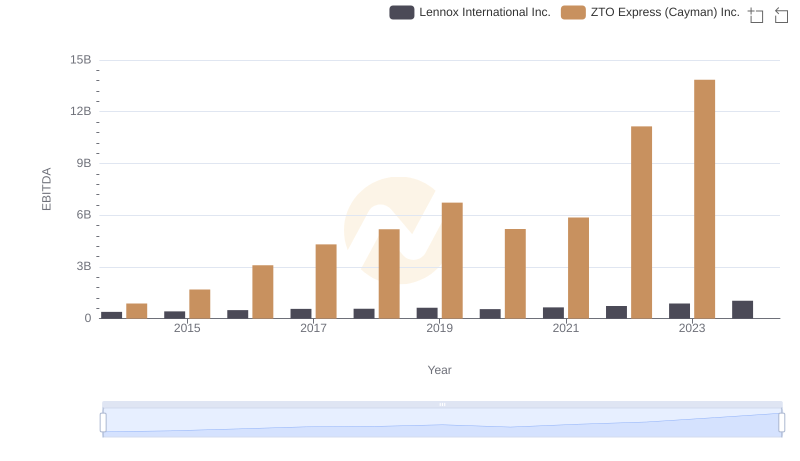
A Professional Review of EBITDA: Lennox International Inc. Compared to ZTO Express (Cayman) Inc.
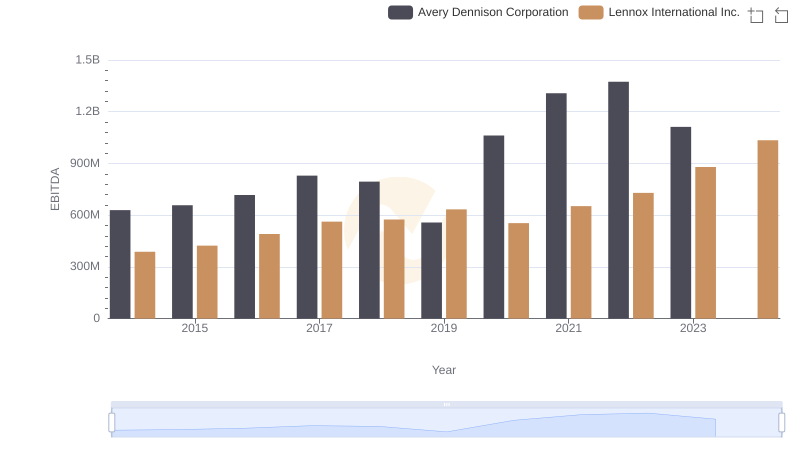
A Professional Review of EBITDA: Lennox International Inc. Compared to Avery Dennison Corporation