| __timestamp | Lennox International Inc. | ZTO Express (Cayman) Inc. |
|---|---|---|
| Wednesday, January 1, 2014 | 387700000 | 876815000 |
| Thursday, January 1, 2015 | 423600000 | 1687285000 |
| Friday, January 1, 2016 | 490800000 | 3093956000 |
| Sunday, January 1, 2017 | 562900000 | 4308801000 |
| Monday, January 1, 2018 | 575200000 | 5185941000 |
| Tuesday, January 1, 2019 | 633300000 | 6727397000 |
| Wednesday, January 1, 2020 | 553900000 | 5197064000 |
| Friday, January 1, 2021 | 652500000 | 5866901000 |
| Saturday, January 1, 2022 | 729000000 | 11147519000 |
| Sunday, January 1, 2023 | 879500000 | 13853443000 |
| Monday, January 1, 2024 | 1034800000 |
Unveiling the hidden dimensions of data
Over the past decade, Lennox International Inc. and ZTO Express (Cayman) Inc. have showcased intriguing financial trajectories. From 2014 to 2023, Lennox International's EBITDA grew by approximately 167%, starting from $388 million and reaching over $1 billion. In contrast, ZTO Express experienced a staggering 1,480% increase, from $877 million to $13.85 billion, highlighting its rapid expansion in the logistics sector.
Lennox International's steady growth reflects its robust presence in the HVAC industry, while ZTO Express's exponential rise underscores the booming e-commerce market in China. Notably, ZTO's EBITDA surpassed Lennox's by over 1,200% in 2023, emphasizing its dominant market position. However, data for ZTO in 2024 is missing, leaving room for speculation on its future performance.
This analysis provides a snapshot of two industry giants, each thriving in their respective domains, yet facing unique challenges and opportunities.
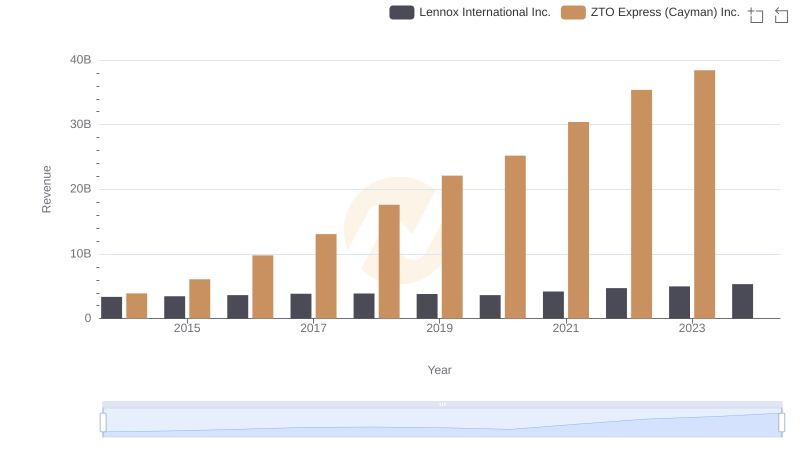
Lennox International Inc. and ZTO Express (Cayman) Inc.: A Comprehensive Revenue Analysis
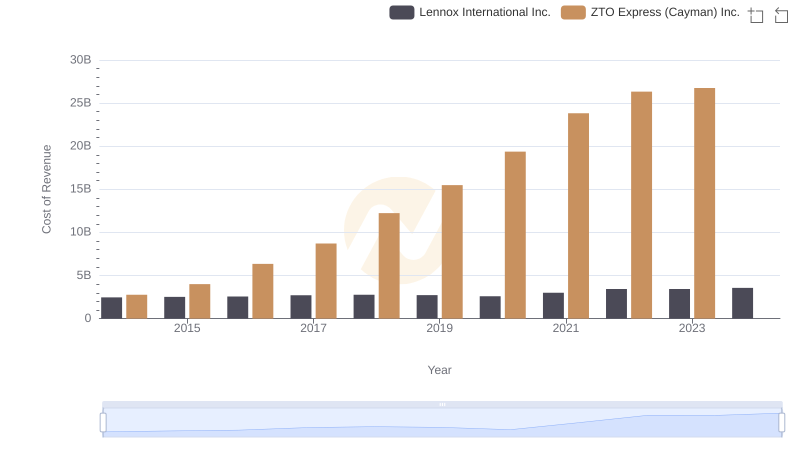
Lennox International Inc. vs ZTO Express (Cayman) Inc.: Efficiency in Cost of Revenue Explored
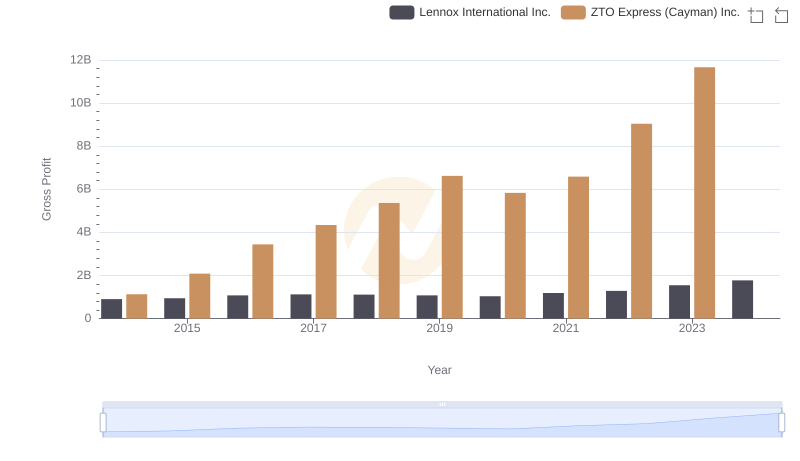
Gross Profit Comparison: Lennox International Inc. and ZTO Express (Cayman) Inc. Trends
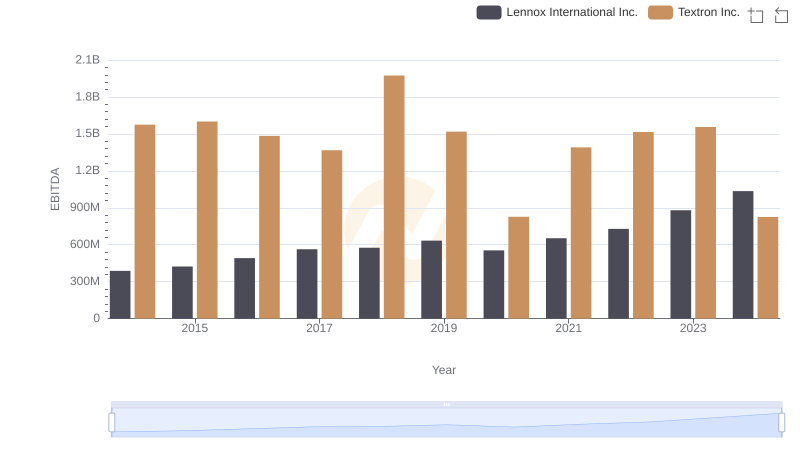
EBITDA Performance Review: Lennox International Inc. vs Textron Inc.
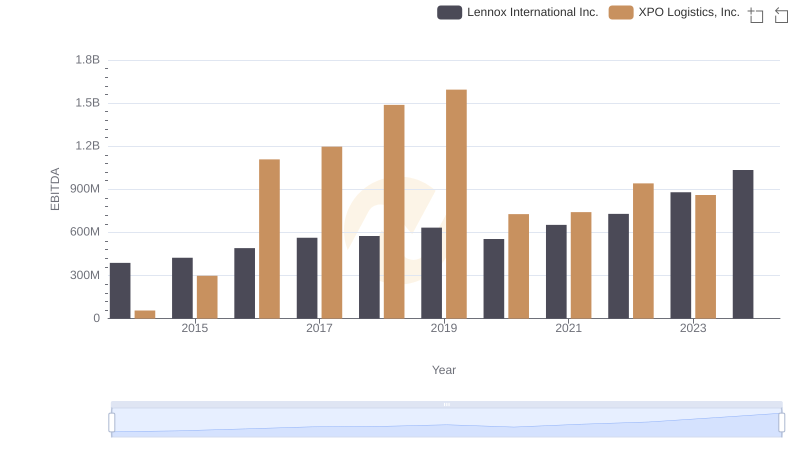
A Professional Review of EBITDA: Lennox International Inc. Compared to XPO Logistics, Inc.
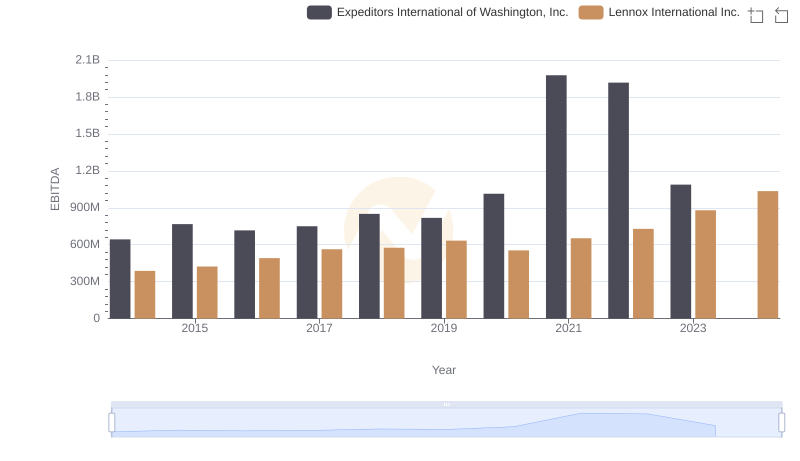
Lennox International Inc. and Expeditors International of Washington, Inc.: A Detailed Examination of EBITDA Performance
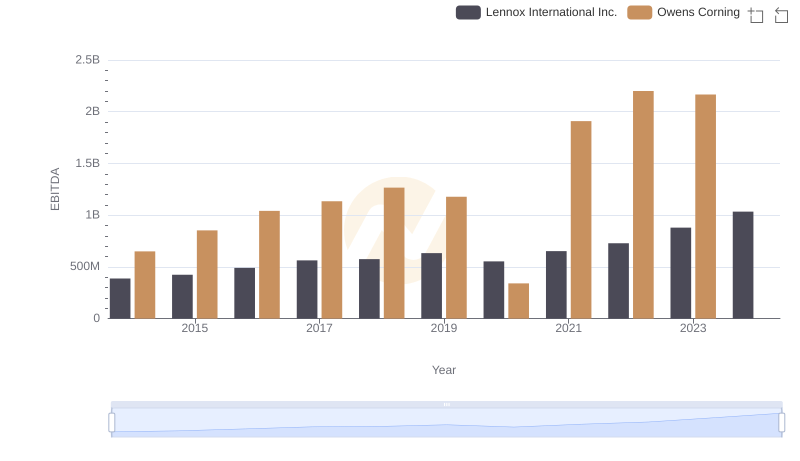
Comparative EBITDA Analysis: Lennox International Inc. vs Owens Corning
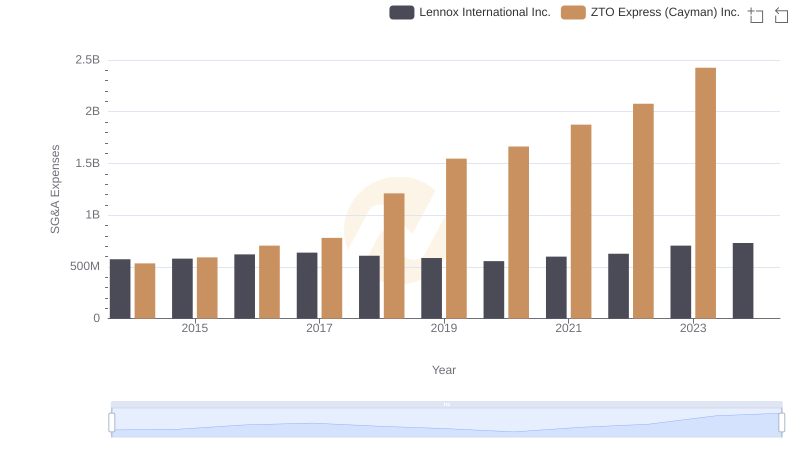
Operational Costs Compared: SG&A Analysis of Lennox International Inc. and ZTO Express (Cayman) Inc.
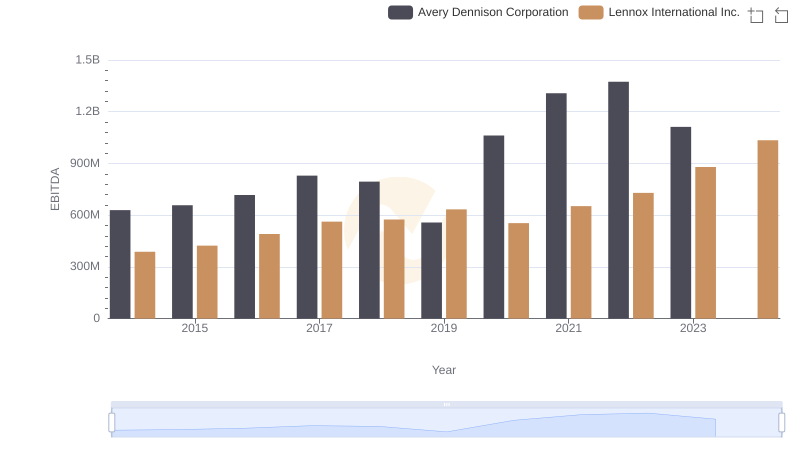
A Professional Review of EBITDA: Lennox International Inc. Compared to Avery Dennison Corporation
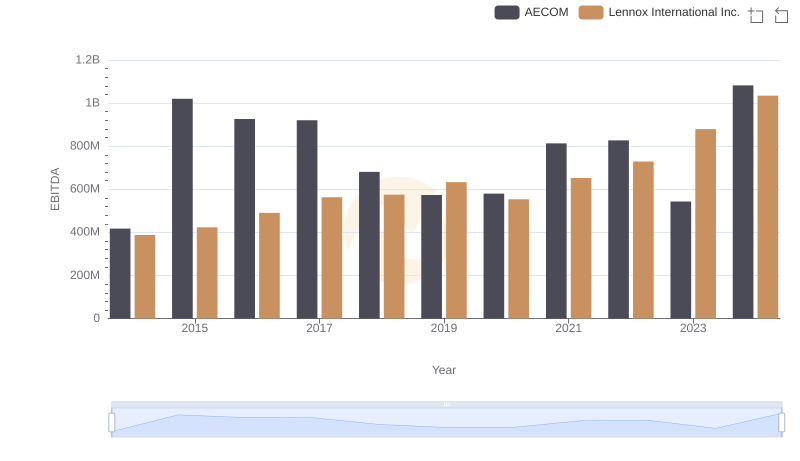
EBITDA Analysis: Evaluating Lennox International Inc. Against AECOM
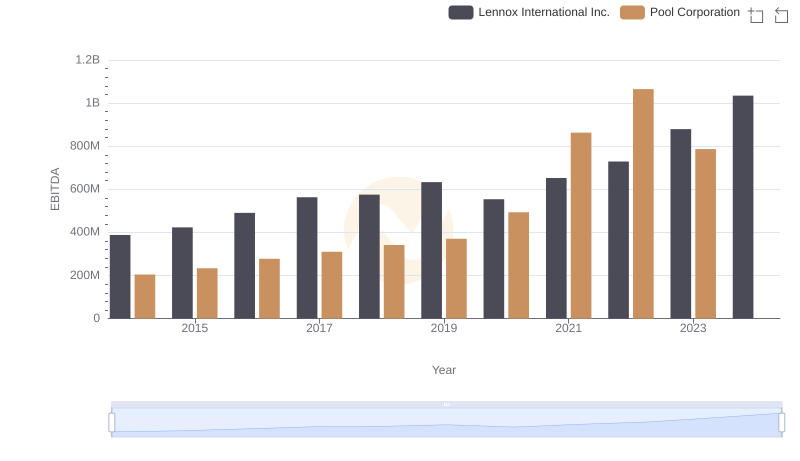
EBITDA Analysis: Evaluating Lennox International Inc. Against Pool Corporation
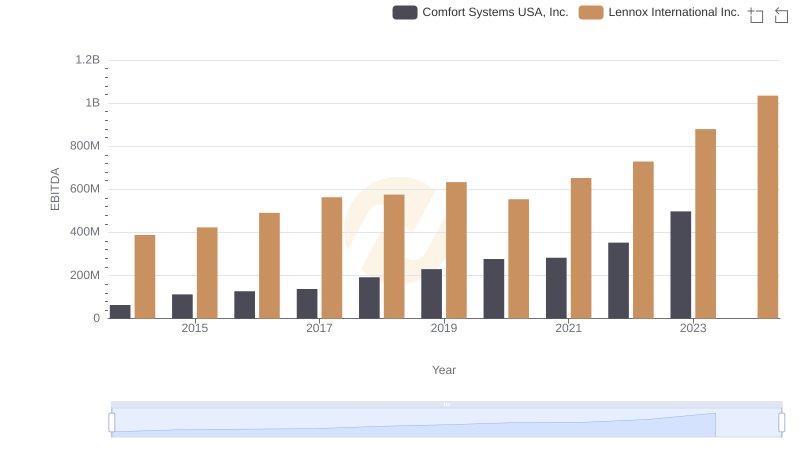
A Professional Review of EBITDA: Lennox International Inc. Compared to Comfort Systems USA, Inc.