| __timestamp | Expeditors International of Washington, Inc. | Lennox International Inc. |
|---|---|---|
| Wednesday, January 1, 2014 | 643940000 | 387700000 |
| Thursday, January 1, 2015 | 767496000 | 423600000 |
| Friday, January 1, 2016 | 716959000 | 490800000 |
| Sunday, January 1, 2017 | 749570000 | 562900000 |
| Monday, January 1, 2018 | 850582000 | 575200000 |
| Tuesday, January 1, 2019 | 817642000 | 633300000 |
| Wednesday, January 1, 2020 | 1013523000 | 553900000 |
| Friday, January 1, 2021 | 1975928000 | 652500000 |
| Saturday, January 1, 2022 | 1916506000 | 729000000 |
| Sunday, January 1, 2023 | 1087588000 | 879500000 |
| Monday, January 1, 2024 | 1154330000 | 1034800000 |
In pursuit of knowledge
In the ever-evolving landscape of corporate finance, EBITDA serves as a crucial indicator of a company's operational efficiency. From 2014 to 2023, Expeditors International of Washington, Inc. and Lennox International Inc. have demonstrated intriguing trends in their EBITDA performance. Expeditors International saw a remarkable growth of approximately 69% from 2014 to 2021, peaking in 2021 with a 197% increase compared to 2014. However, 2023 marked a decline, with EBITDA dropping by around 45% from its 2021 high. In contrast, Lennox International exhibited a steady upward trajectory, with a 127% increase from 2014 to 2023, despite a slight dip in 2020. Notably, 2024 data for Expeditors is missing, leaving room for speculation on future performance. This analysis underscores the dynamic nature of financial metrics and their implications for strategic business decisions.
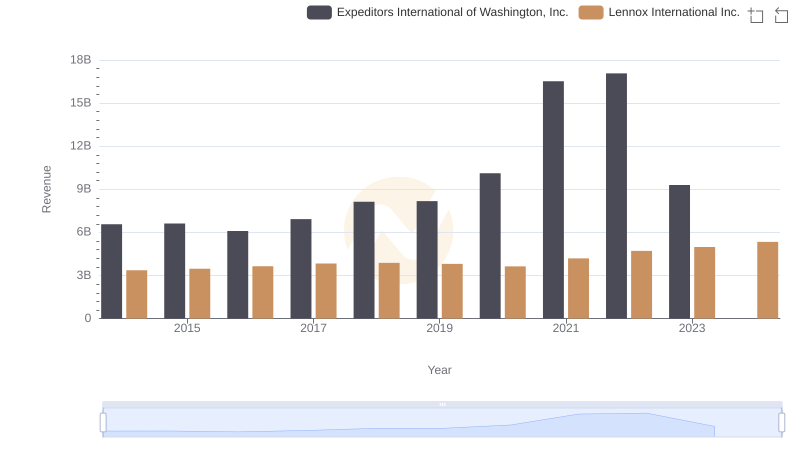
Lennox International Inc. vs Expeditors International of Washington, Inc.: Examining Key Revenue Metrics
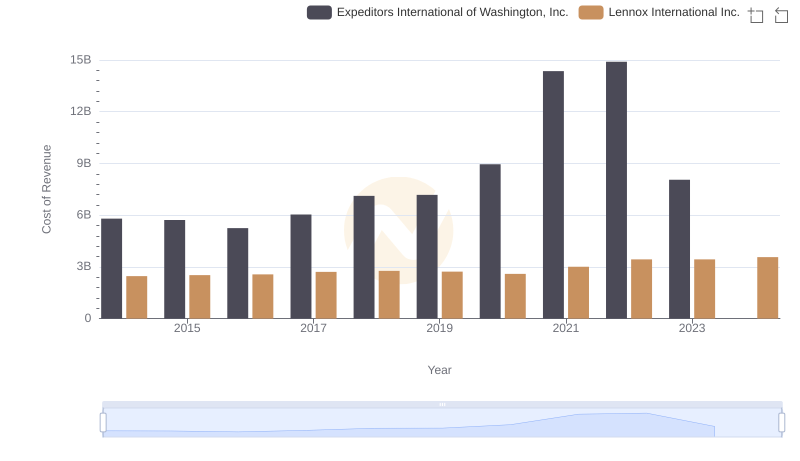
Cost Insights: Breaking Down Lennox International Inc. and Expeditors International of Washington, Inc.'s Expenses
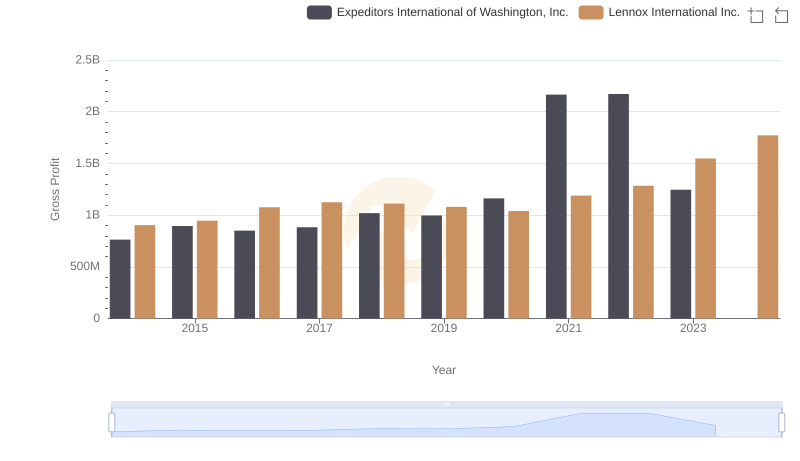
Gross Profit Trends Compared: Lennox International Inc. vs Expeditors International of Washington, Inc.
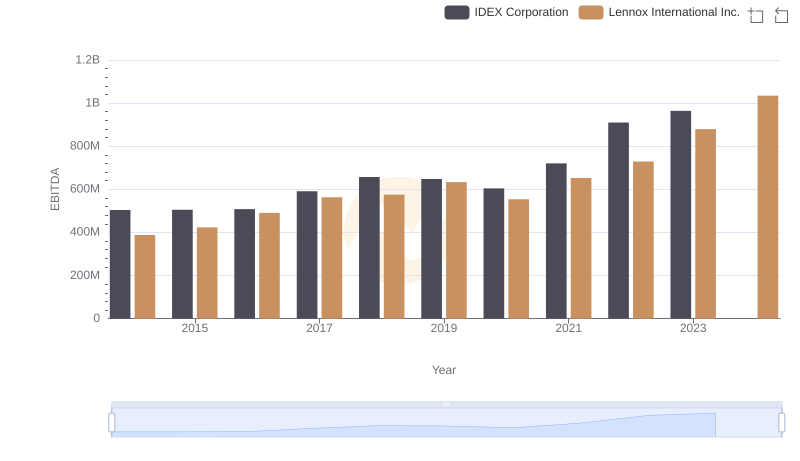
A Professional Review of EBITDA: Lennox International Inc. Compared to IDEX Corporation
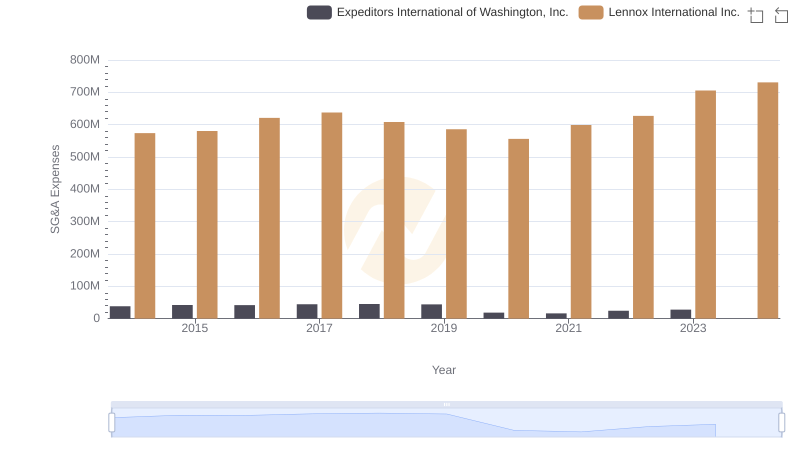
SG&A Efficiency Analysis: Comparing Lennox International Inc. and Expeditors International of Washington, Inc.
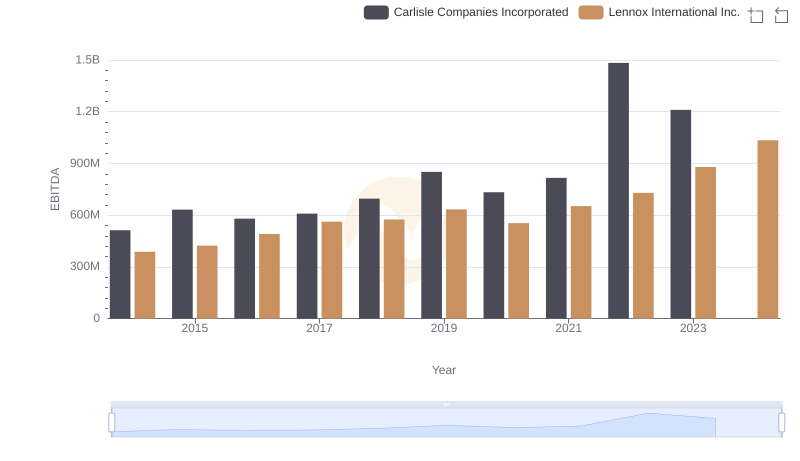
A Side-by-Side Analysis of EBITDA: Lennox International Inc. and Carlisle Companies Incorporated
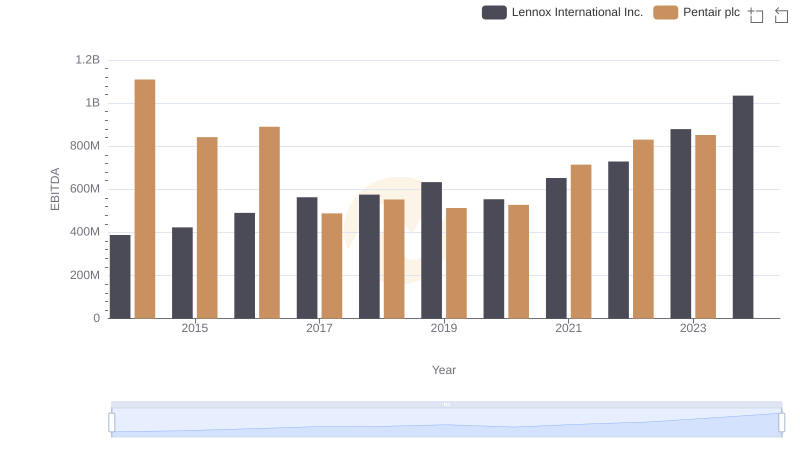
Comparative EBITDA Analysis: Lennox International Inc. vs Pentair plc
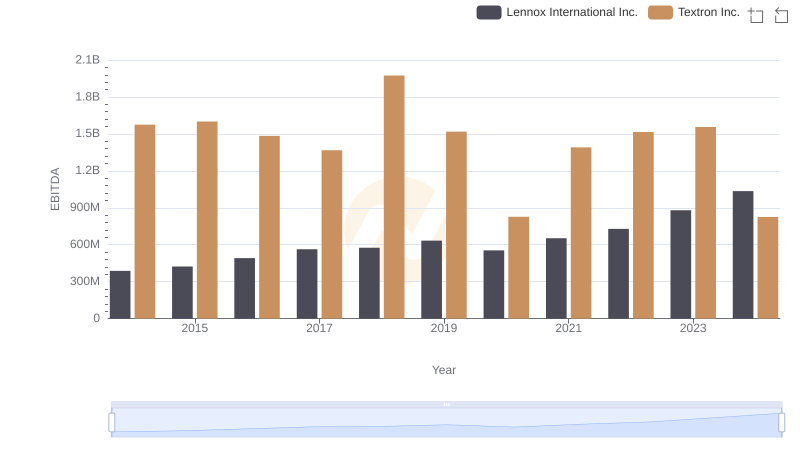
EBITDA Performance Review: Lennox International Inc. vs Textron Inc.
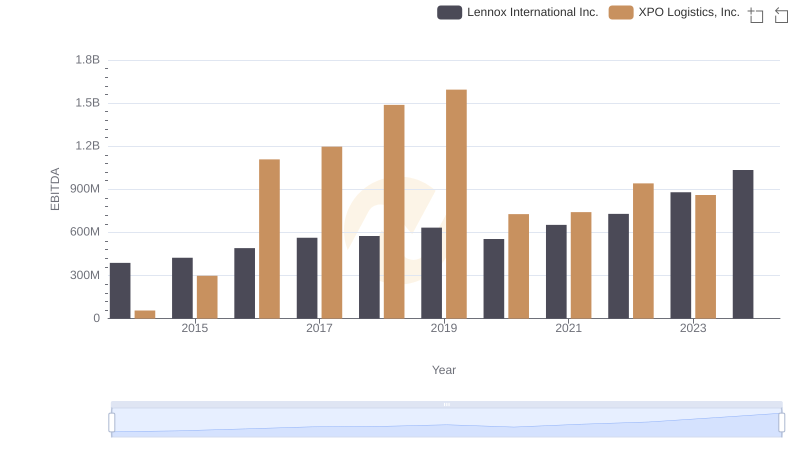
A Professional Review of EBITDA: Lennox International Inc. Compared to XPO Logistics, Inc.
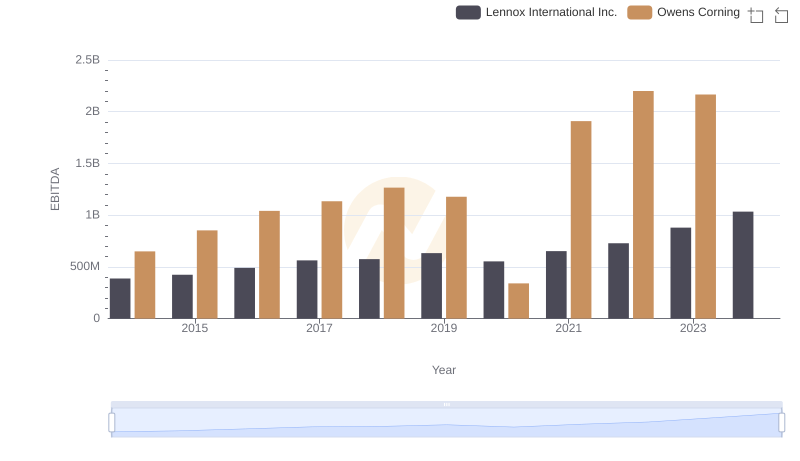
Comparative EBITDA Analysis: Lennox International Inc. vs Owens Corning
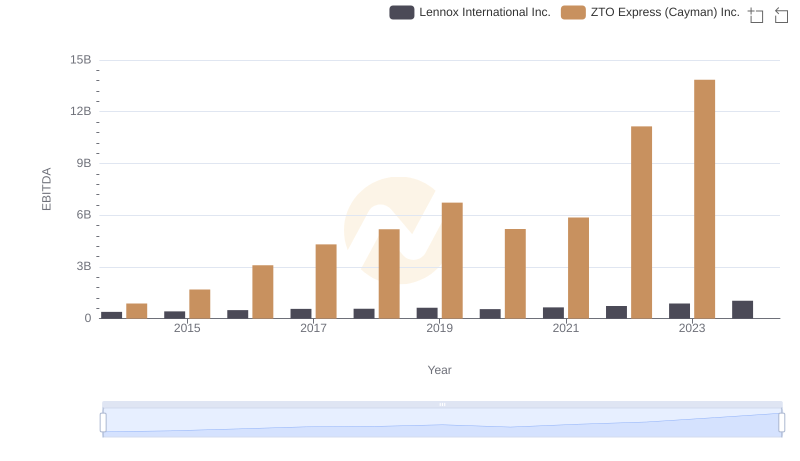
A Professional Review of EBITDA: Lennox International Inc. Compared to ZTO Express (Cayman) Inc.
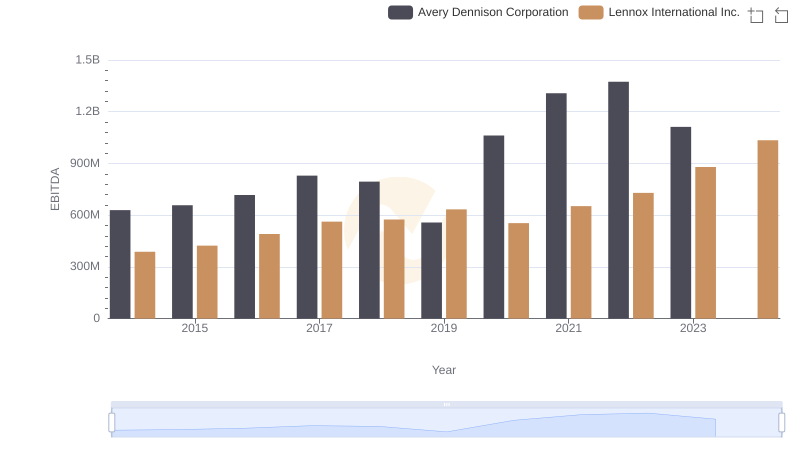
A Professional Review of EBITDA: Lennox International Inc. Compared to Avery Dennison Corporation