| __timestamp | Global Payments Inc. | Masco Corporation |
|---|---|---|
| Wednesday, January 1, 2014 | 594102000 | 899000000 |
| Thursday, January 1, 2015 | 618109000 | 1041000000 |
| Friday, January 1, 2016 | 748136000 | 1220000000 |
| Sunday, January 1, 2017 | 1010019000 | 1314000000 |
| Monday, January 1, 2018 | 1315968000 | 1240000000 |
| Tuesday, January 1, 2019 | 1764994000 | 1244000000 |
| Wednesday, January 1, 2020 | 2508393000 | 1410000000 |
| Friday, January 1, 2021 | 3233589000 | 1185000000 |
| Saturday, January 1, 2022 | 2427684000 | 1490000000 |
| Sunday, January 1, 2023 | 3606789000 | 1493000000 |
| Monday, January 1, 2024 | 2333605000 | 1410000000 |
Infusing magic into the data realm
In the ever-evolving landscape of financial performance, EBITDA serves as a crucial indicator of a company's operational efficiency. Over the past decade, Global Payments Inc. has demonstrated a remarkable growth trajectory, with its EBITDA surging by over 530% from 2014 to 2023. This impressive rise highlights the company's strategic prowess in navigating the competitive payments industry. In contrast, Masco Corporation, a leader in home improvement and building products, has shown a steady yet modest EBITDA growth of approximately 66% during the same period. This stability underscores Masco's resilience in a fluctuating market. Notably, Global Payments Inc. experienced a peak in 2023, with EBITDA reaching its highest point, while Masco Corporation maintained a consistent performance. These insights offer a compelling narrative of how two industry giants have adapted and thrived in their respective sectors over the years.
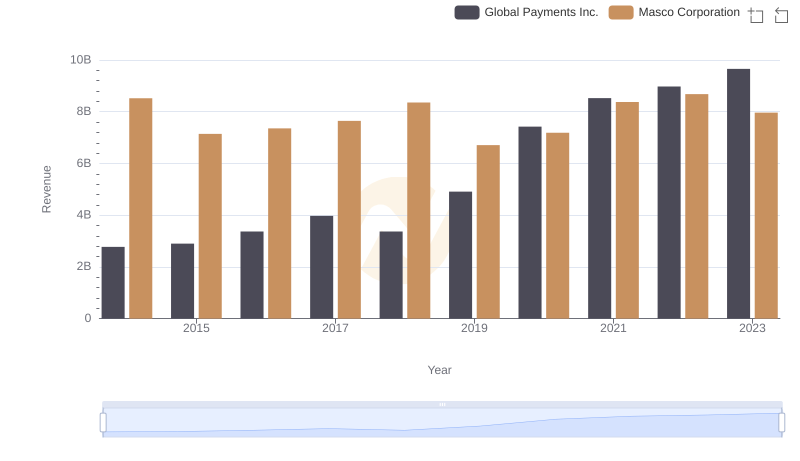
Global Payments Inc. vs Masco Corporation: Examining Key Revenue Metrics
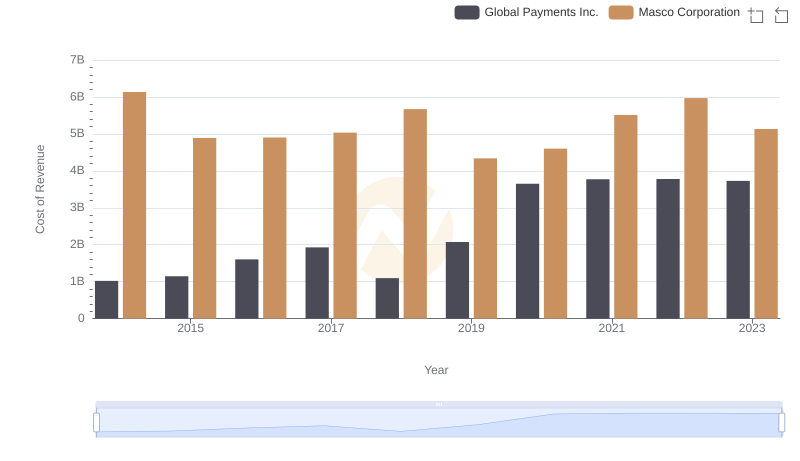
Analyzing Cost of Revenue: Global Payments Inc. and Masco Corporation
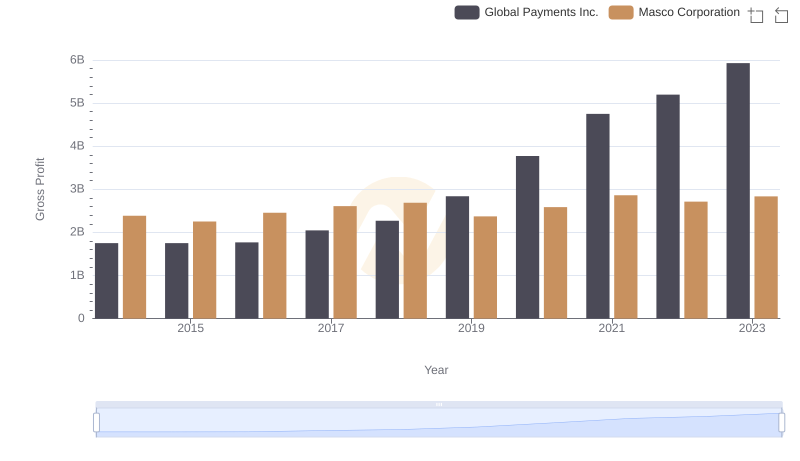
Gross Profit Comparison: Global Payments Inc. and Masco Corporation Trends
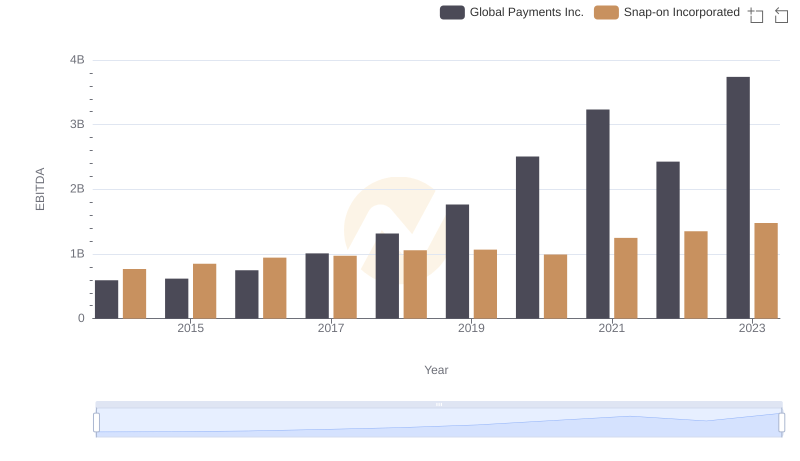
EBITDA Metrics Evaluated: Global Payments Inc. vs Snap-on Incorporated
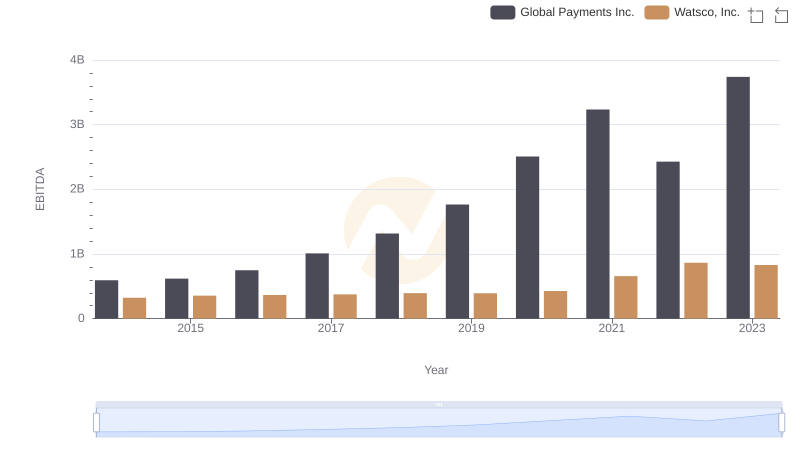
EBITDA Metrics Evaluated: Global Payments Inc. vs Watsco, Inc.
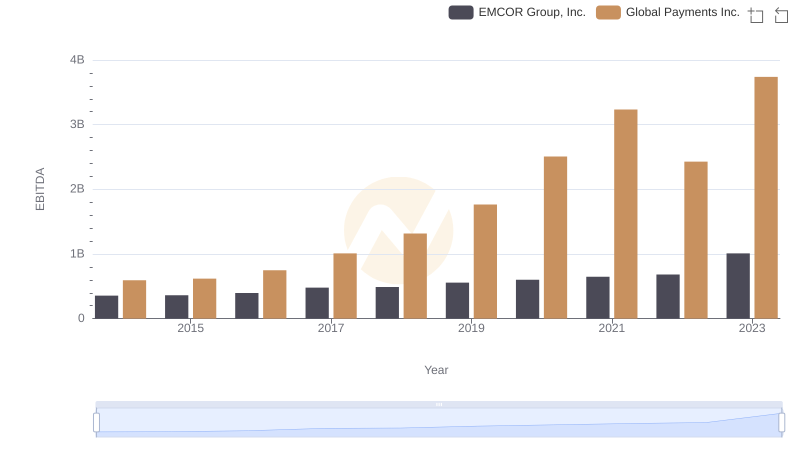
A Side-by-Side Analysis of EBITDA: Global Payments Inc. and EMCOR Group, Inc.
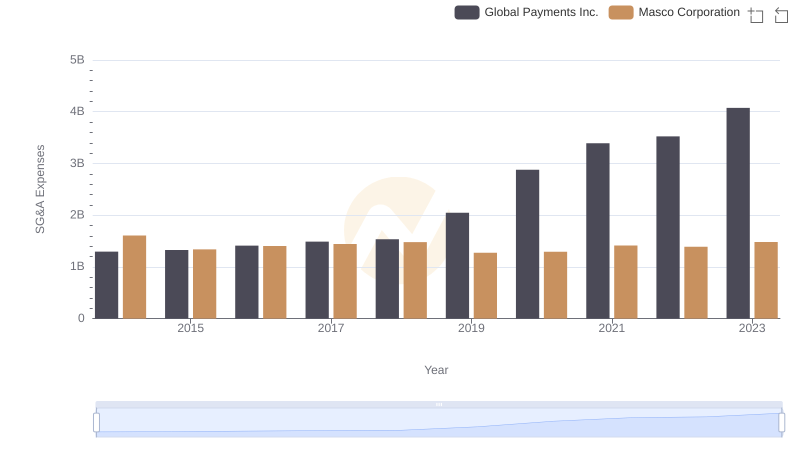
Breaking Down SG&A Expenses: Global Payments Inc. vs Masco Corporation

Global Payments Inc. vs TransUnion: In-Depth EBITDA Performance Comparison
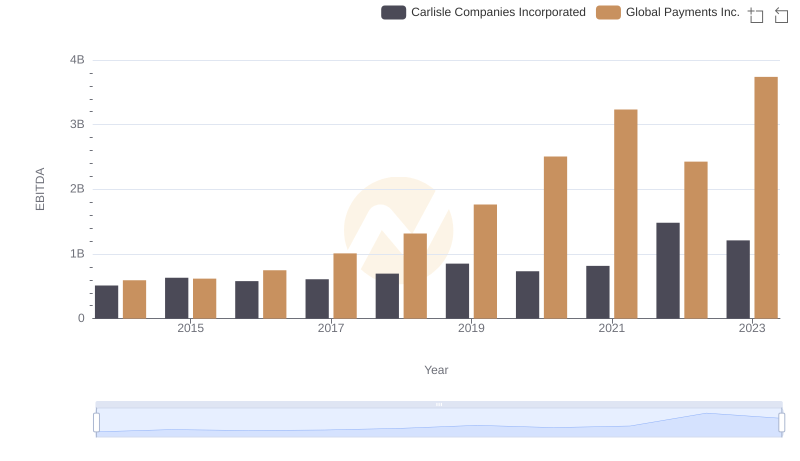
EBITDA Analysis: Evaluating Global Payments Inc. Against Carlisle Companies Incorporated
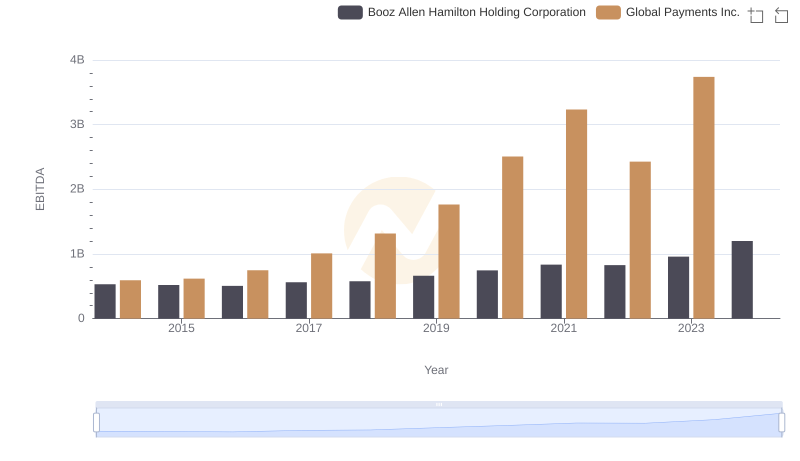
A Side-by-Side Analysis of EBITDA: Global Payments Inc. and Booz Allen Hamilton Holding Corporation
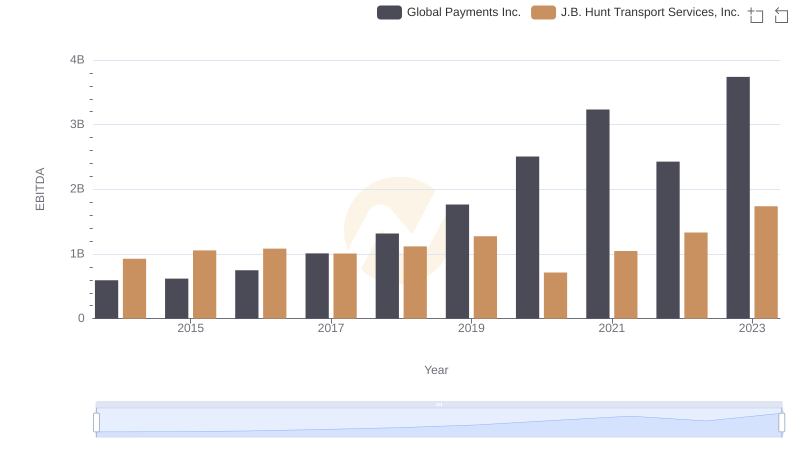
Comprehensive EBITDA Comparison: Global Payments Inc. vs J.B. Hunt Transport Services, Inc.
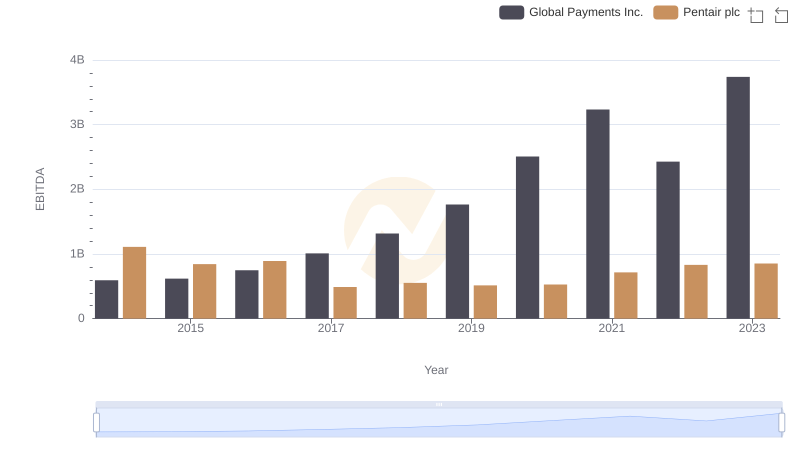
Professional EBITDA Benchmarking: Global Payments Inc. vs Pentair plc