| __timestamp | Global Payments Inc. | Masco Corporation |
|---|---|---|
| Wednesday, January 1, 2014 | 2773718000 | 8521000000 |
| Thursday, January 1, 2015 | 2898150000 | 7142000000 |
| Friday, January 1, 2016 | 3370976000 | 7357000000 |
| Sunday, January 1, 2017 | 3975163000 | 7644000000 |
| Monday, January 1, 2018 | 3366366000 | 8359000000 |
| Tuesday, January 1, 2019 | 4911892000 | 6707000000 |
| Wednesday, January 1, 2020 | 7423558000 | 7188000000 |
| Friday, January 1, 2021 | 8523762000 | 8375000000 |
| Saturday, January 1, 2022 | 8975515000 | 8680000000 |
| Sunday, January 1, 2023 | 9654419000 | 7967000000 |
| Monday, January 1, 2024 | 10105894000 | 7828000000 |
Unleashing insights
In the ever-evolving landscape of global commerce, Global Payments Inc. and Masco Corporation stand as titans in their respective industries. Over the past decade, Global Payments Inc. has seen a remarkable revenue growth of approximately 248%, surging from $2.8 billion in 2014 to an impressive $9.7 billion in 2023. This growth trajectory underscores the company's strategic expansions and technological advancements in the payment processing sector.
Conversely, Masco Corporation, a leader in home improvement and building products, has experienced a more stable revenue pattern. Despite fluctuations, Masco's revenue has maintained a steady average of around $7.8 billion annually, peaking at $8.7 billion in 2022. This stability reflects the company's resilience and adaptability in a competitive market.
As we delve into these financial narratives, the contrasting revenue trends of these two corporations offer a fascinating glimpse into the dynamics of their industries.
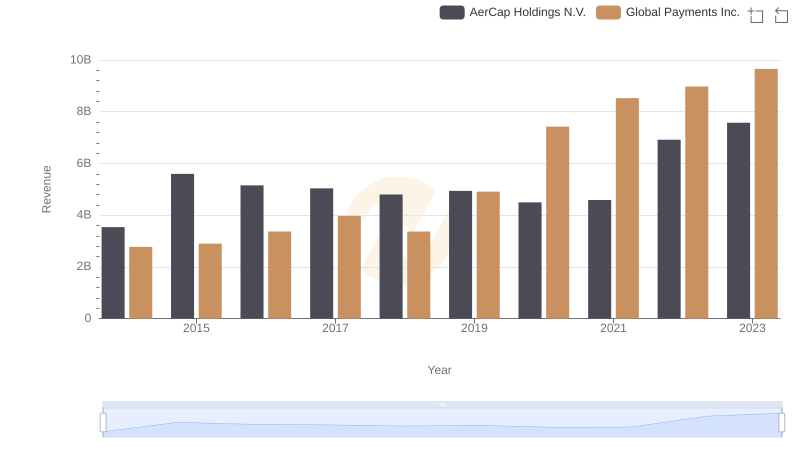
Global Payments Inc. vs AerCap Holdings N.V.: Examining Key Revenue Metrics
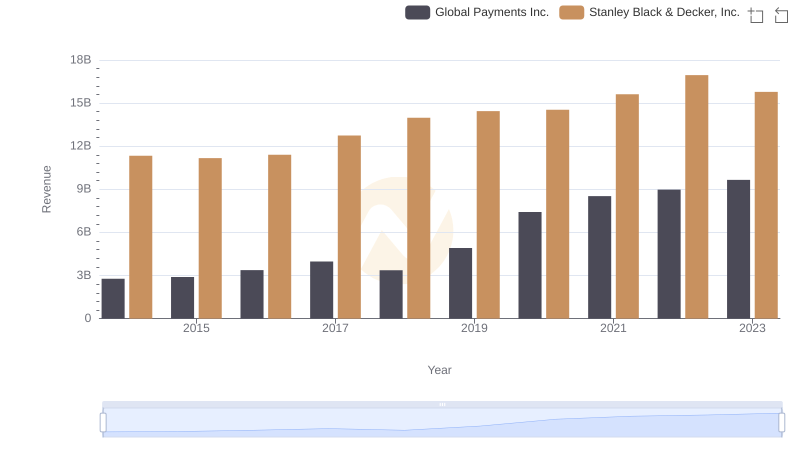
Global Payments Inc. vs Stanley Black & Decker, Inc.: Examining Key Revenue Metrics
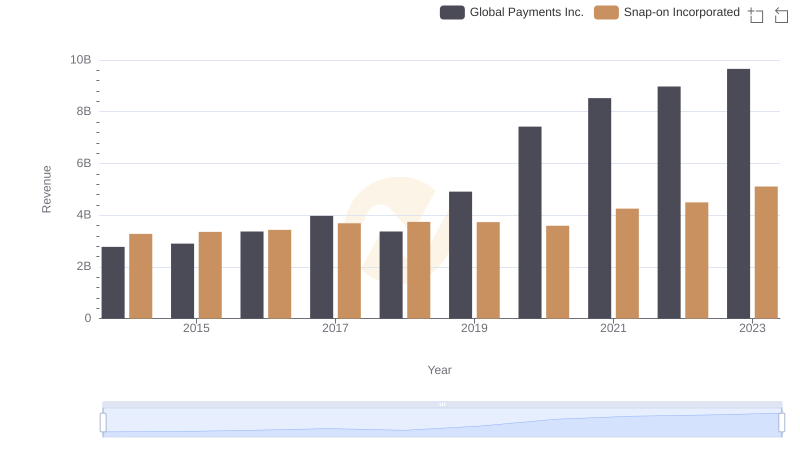
Global Payments Inc. vs Snap-on Incorporated: Examining Key Revenue Metrics
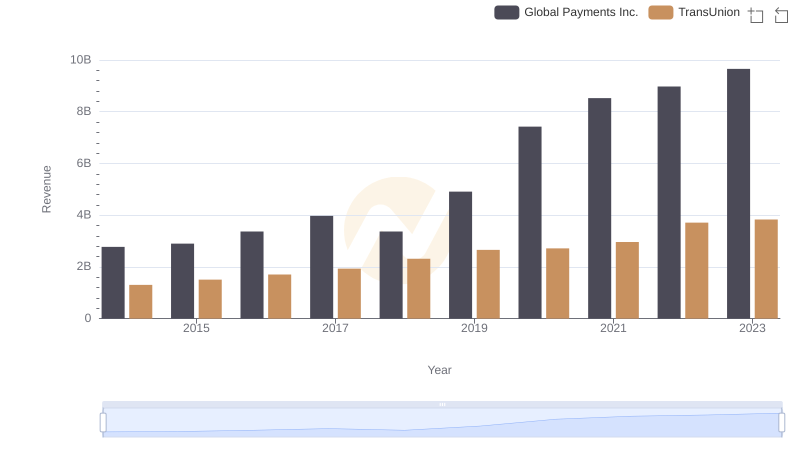
Revenue Insights: Global Payments Inc. and TransUnion Performance Compared
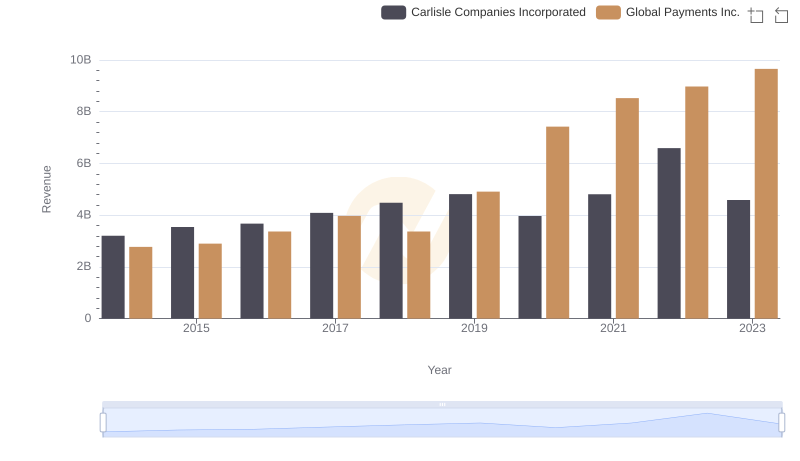
Global Payments Inc. vs Carlisle Companies Incorporated: Examining Key Revenue Metrics
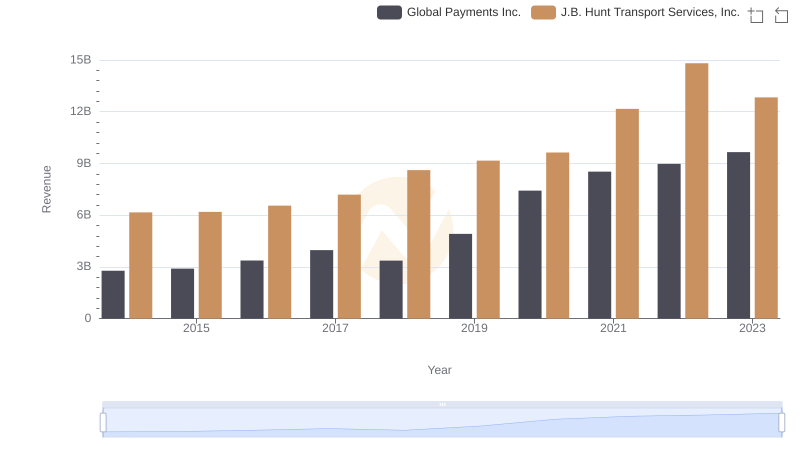
Global Payments Inc. or J.B. Hunt Transport Services, Inc.: Who Leads in Yearly Revenue?
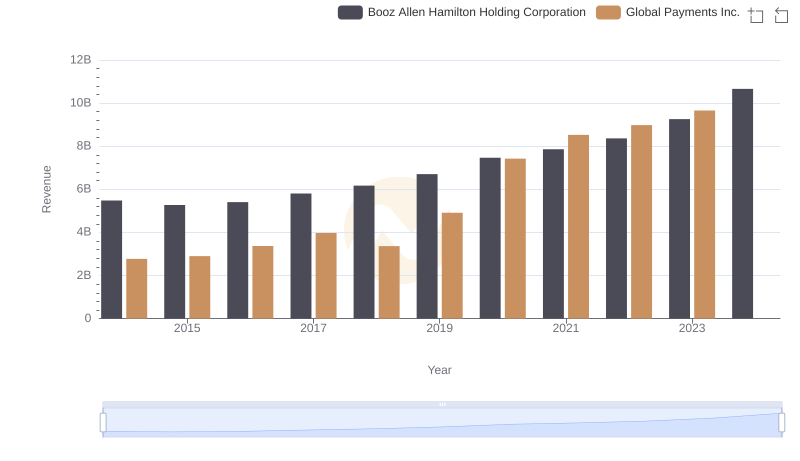
Comparing Revenue Performance: Global Payments Inc. or Booz Allen Hamilton Holding Corporation?
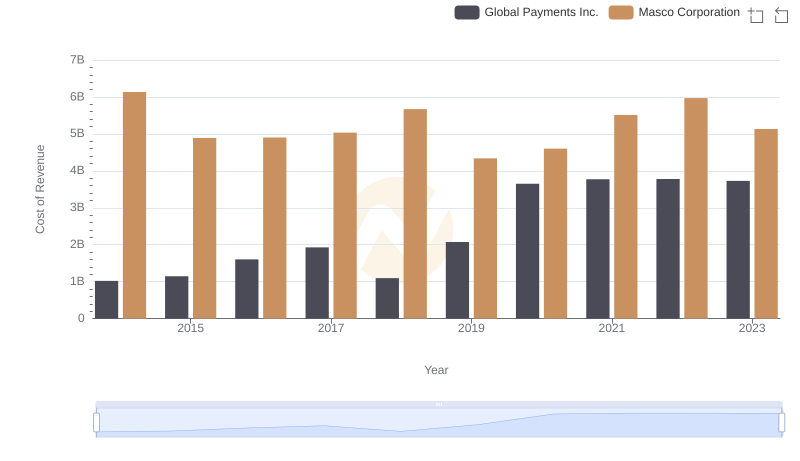
Analyzing Cost of Revenue: Global Payments Inc. and Masco Corporation
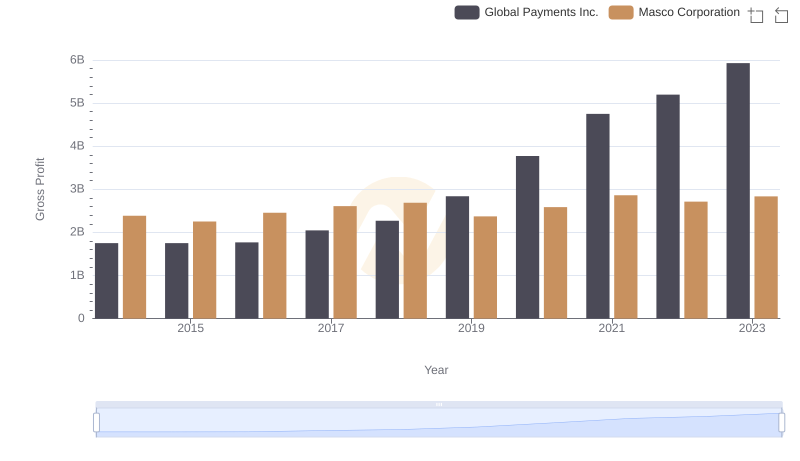
Gross Profit Comparison: Global Payments Inc. and Masco Corporation Trends
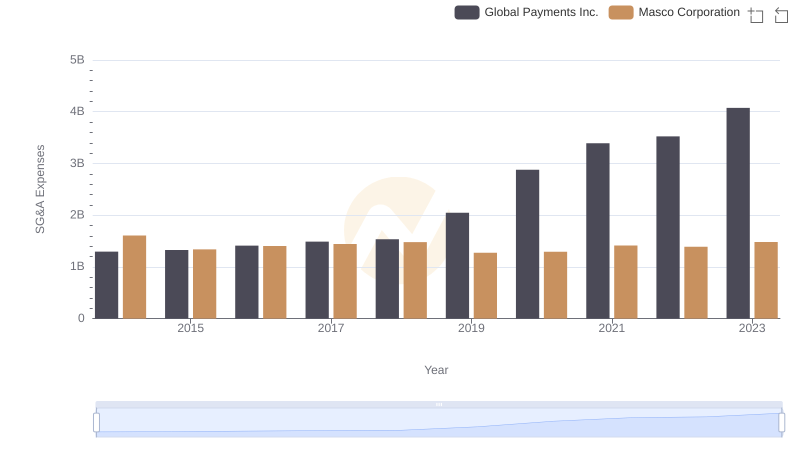
Breaking Down SG&A Expenses: Global Payments Inc. vs Masco Corporation
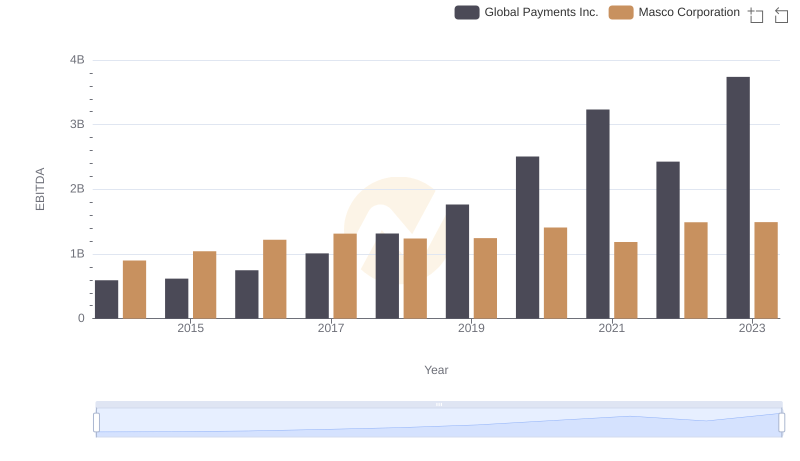
EBITDA Performance Review: Global Payments Inc. vs Masco Corporation