| __timestamp | Global Payments Inc. | Masco Corporation |
|---|---|---|
| Wednesday, January 1, 2014 | 1295014000 | 1607000000 |
| Thursday, January 1, 2015 | 1325567000 | 1339000000 |
| Friday, January 1, 2016 | 1411096000 | 1403000000 |
| Sunday, January 1, 2017 | 1488258000 | 1442000000 |
| Monday, January 1, 2018 | 1534297000 | 1478000000 |
| Tuesday, January 1, 2019 | 2046672000 | 1274000000 |
| Wednesday, January 1, 2020 | 2878878000 | 1292000000 |
| Friday, January 1, 2021 | 3391161000 | 1413000000 |
| Saturday, January 1, 2022 | 3524578000 | 1390000000 |
| Sunday, January 1, 2023 | 4073768000 | 1481000000 |
| Monday, January 1, 2024 | 4285307000 | 1468000000 |
Igniting the spark of knowledge
In the ever-evolving landscape of corporate finance, understanding the nuances of Selling, General, and Administrative (SG&A) expenses is crucial. Over the past decade, Global Payments Inc. has seen a remarkable 214% increase in SG&A expenses, rising from approximately $1.3 billion in 2014 to over $4 billion in 2023. This growth reflects the company's aggressive expansion and strategic investments.
Conversely, Masco Corporation's SG&A expenses have remained relatively stable, fluctuating modestly around the $1.4 billion mark. This stability suggests a consistent operational strategy, focusing on efficiency and cost management.
The contrasting trends between these two industry giants highlight different strategic approaches: Global Payments Inc.'s dynamic growth strategy versus Masco Corporation's steady operational focus. As businesses navigate the complexities of the modern economy, these insights into SG&A expenses offer valuable lessons in balancing growth and stability.
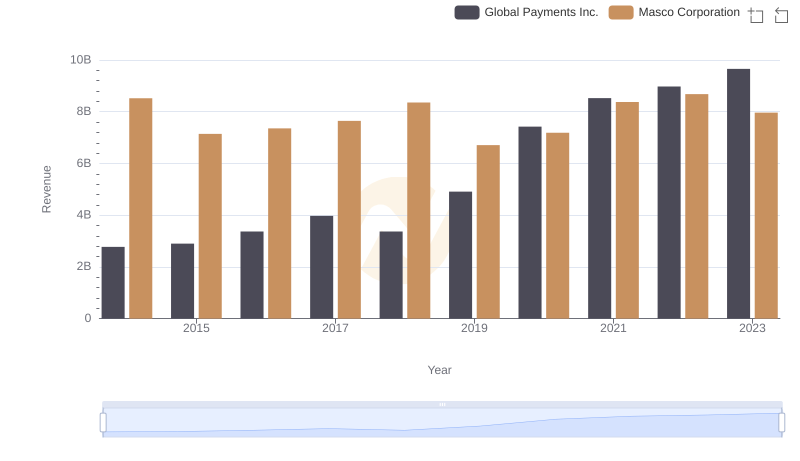
Global Payments Inc. vs Masco Corporation: Examining Key Revenue Metrics
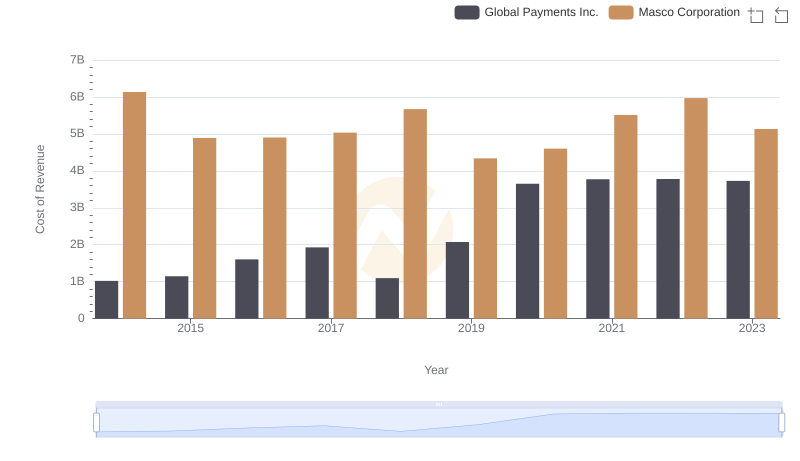
Analyzing Cost of Revenue: Global Payments Inc. and Masco Corporation
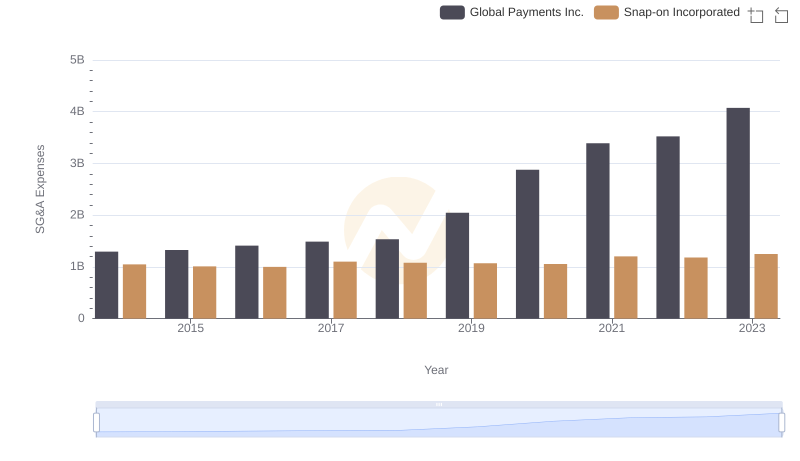
Operational Costs Compared: SG&A Analysis of Global Payments Inc. and Snap-on Incorporated
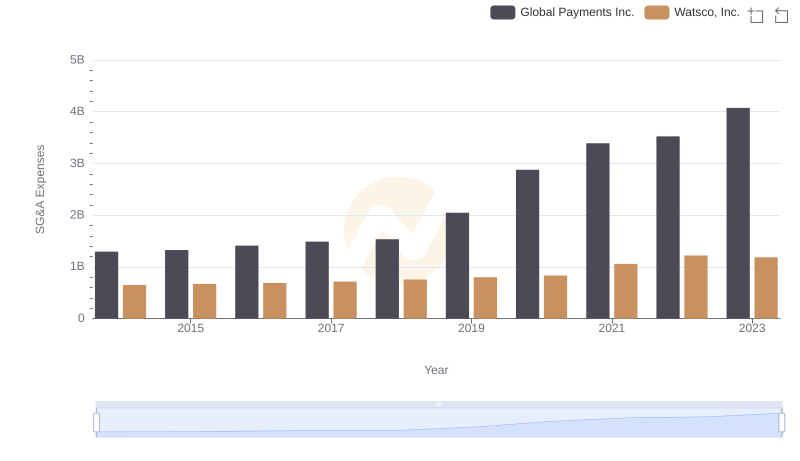
Global Payments Inc. vs Watsco, Inc.: SG&A Expense Trends
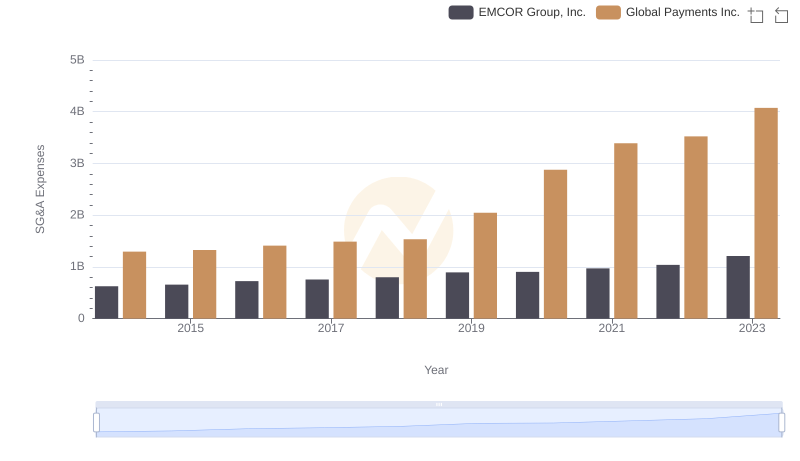
Comparing SG&A Expenses: Global Payments Inc. vs EMCOR Group, Inc. Trends and Insights
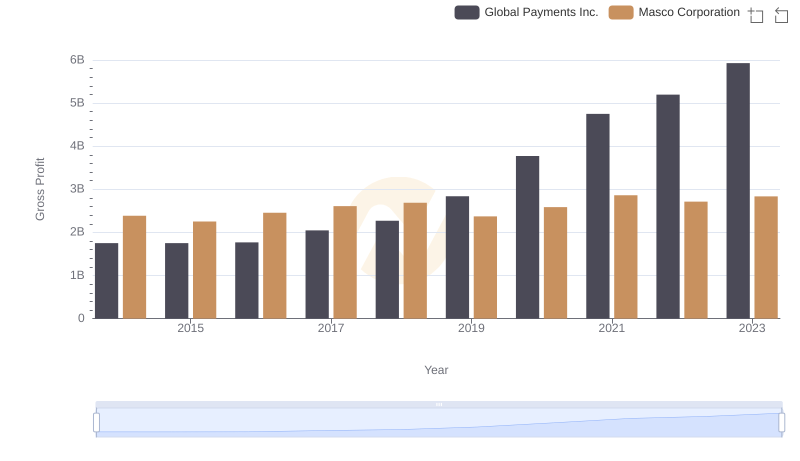
Gross Profit Comparison: Global Payments Inc. and Masco Corporation Trends
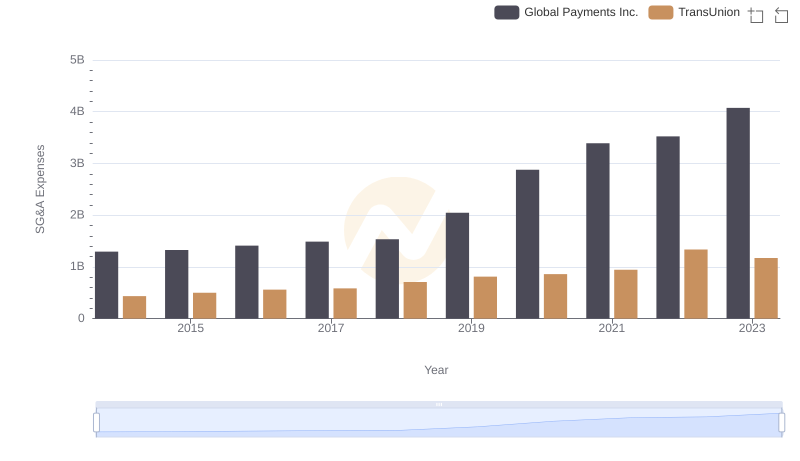
Selling, General, and Administrative Costs: Global Payments Inc. vs TransUnion

Global Payments Inc. vs J.B. Hunt Transport Services, Inc.: SG&A Expense Trends
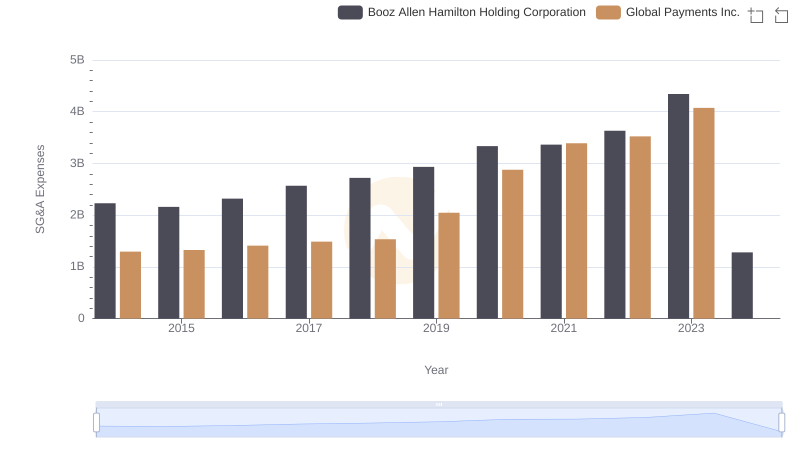
Who Optimizes SG&A Costs Better? Global Payments Inc. or Booz Allen Hamilton Holding Corporation
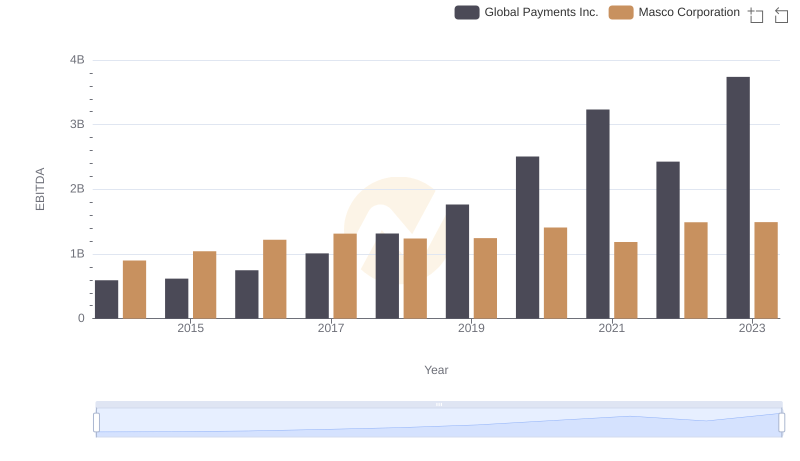
EBITDA Performance Review: Global Payments Inc. vs Masco Corporation
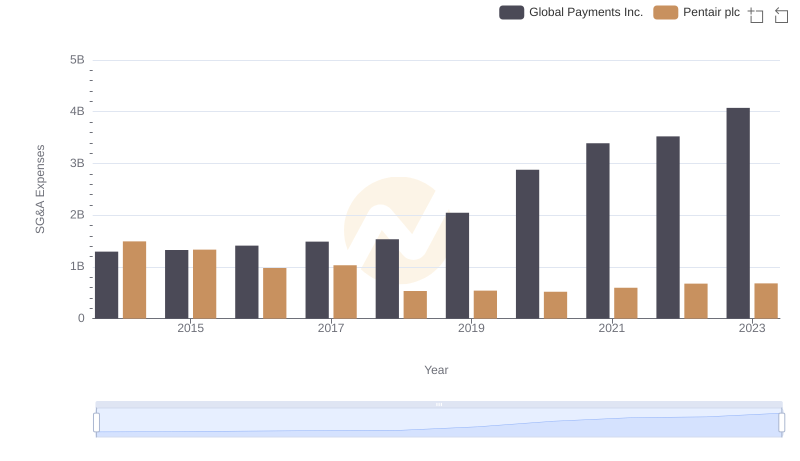
Selling, General, and Administrative Costs: Global Payments Inc. vs Pentair plc