| __timestamp | Global Payments Inc. | TransUnion |
|---|---|---|
| Wednesday, January 1, 2014 | 594102000 | 429400000 |
| Thursday, January 1, 2015 | 618109000 | 478200000 |
| Friday, January 1, 2016 | 748136000 | 585300000 |
| Sunday, January 1, 2017 | 1010019000 | 701100000 |
| Monday, January 1, 2018 | 1315968000 | 819800000 |
| Tuesday, January 1, 2019 | 1764994000 | 993200000 |
| Wednesday, January 1, 2020 | 2508393000 | 883400000 |
| Friday, January 1, 2021 | 3233589000 | 1010500000 |
| Saturday, January 1, 2022 | 2427684000 | 1173800000 |
| Sunday, January 1, 2023 | 3606789000 | 667300000 |
| Monday, January 1, 2024 | 2333605000 | 1204100000 |
Unveiling the hidden dimensions of data
In the ever-evolving financial landscape, understanding the EBITDA performance of industry giants like Global Payments Inc. and TransUnion offers invaluable insights. Over the past decade, Global Payments Inc. has demonstrated a remarkable growth trajectory, with its EBITDA surging by over 530% from 2014 to 2023. This growth underscores its strategic prowess in navigating market challenges and capitalizing on opportunities.
Conversely, TransUnion, while showing a steady increase, has experienced a more modest growth of approximately 55% during the same period. This contrast highlights the dynamic nature of the financial services sector, where adaptability and innovation are key.
The data reveals a pivotal year in 2023, where Global Payments Inc. achieved its highest EBITDA, nearly six times that of TransUnion. This performance gap emphasizes the competitive edge Global Payments Inc. has carved out in the market.
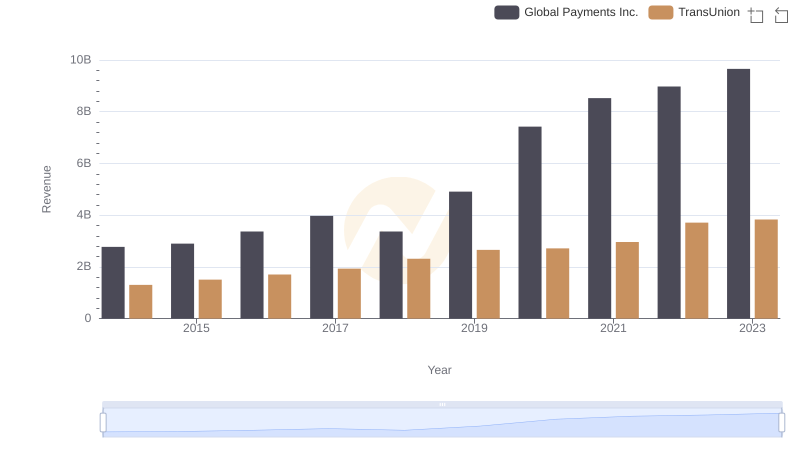
Revenue Insights: Global Payments Inc. and TransUnion Performance Compared
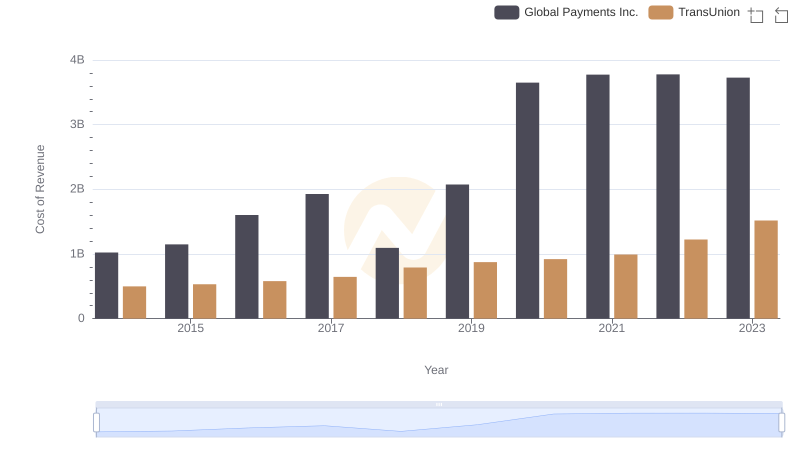
Cost of Revenue Trends: Global Payments Inc. vs TransUnion
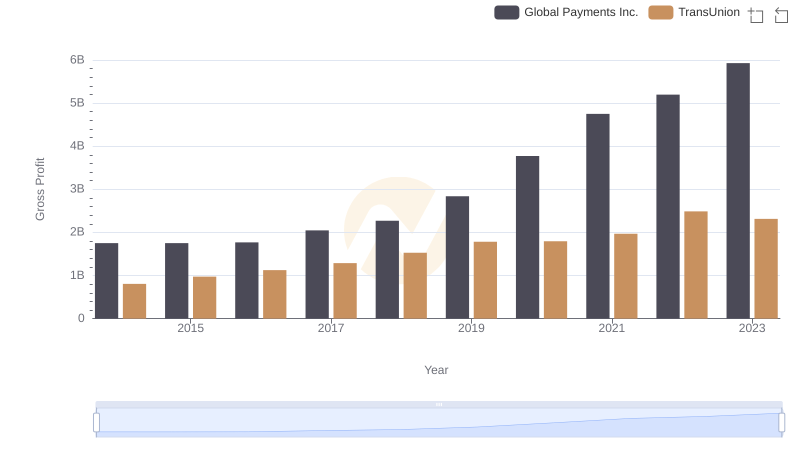
Global Payments Inc. and TransUnion: A Detailed Gross Profit Analysis
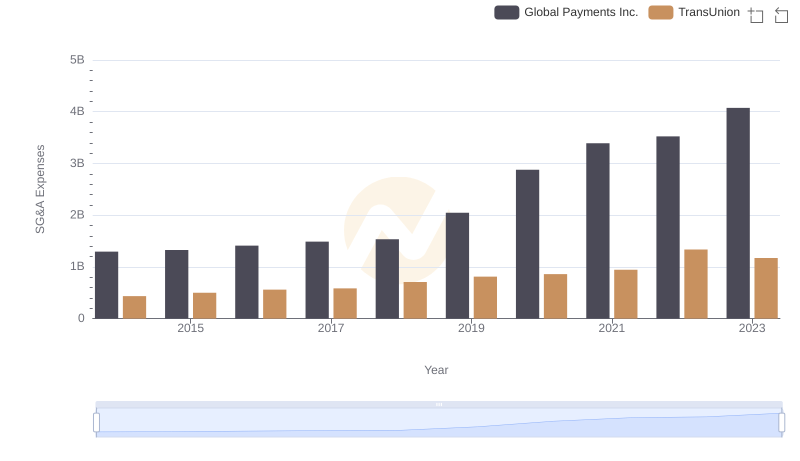
Selling, General, and Administrative Costs: Global Payments Inc. vs TransUnion
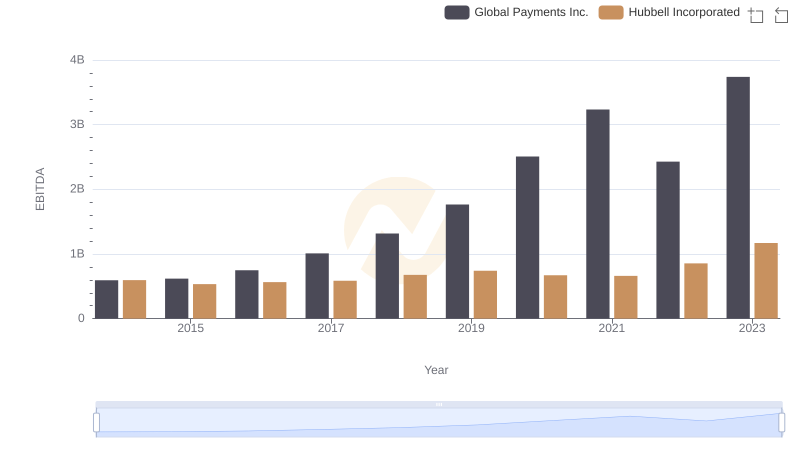
Comparative EBITDA Analysis: Global Payments Inc. vs Hubbell Incorporated
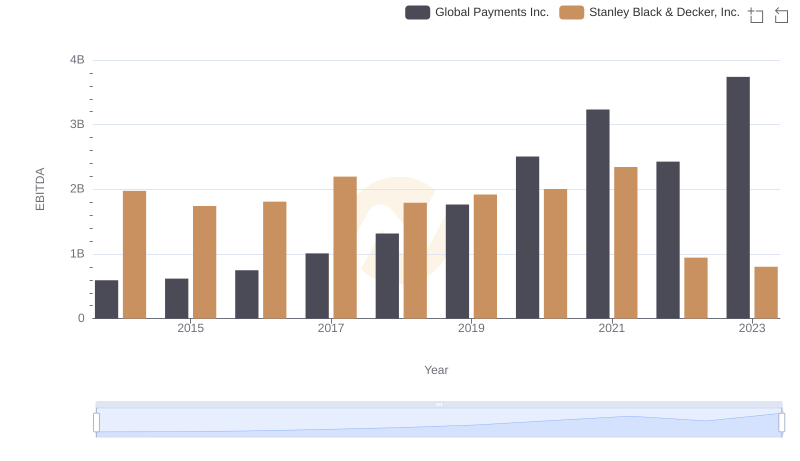
EBITDA Metrics Evaluated: Global Payments Inc. vs Stanley Black & Decker, Inc.
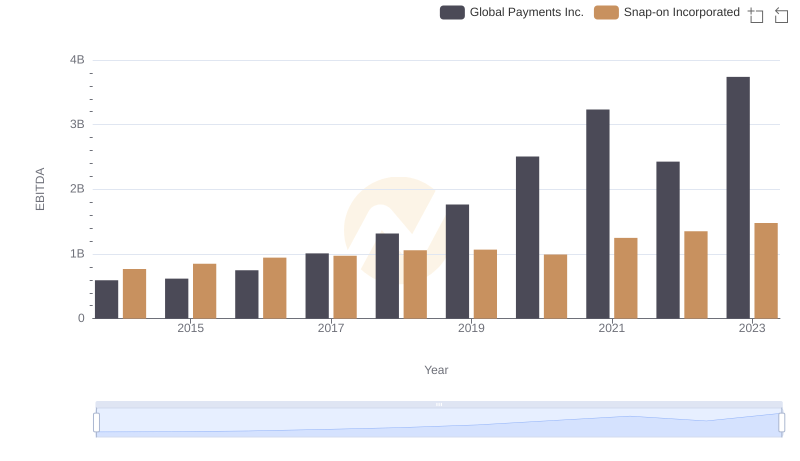
EBITDA Metrics Evaluated: Global Payments Inc. vs Snap-on Incorporated
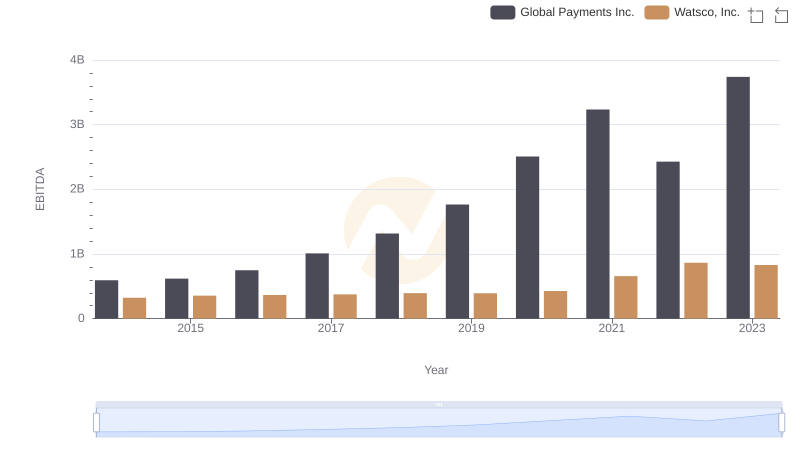
EBITDA Metrics Evaluated: Global Payments Inc. vs Watsco, Inc.
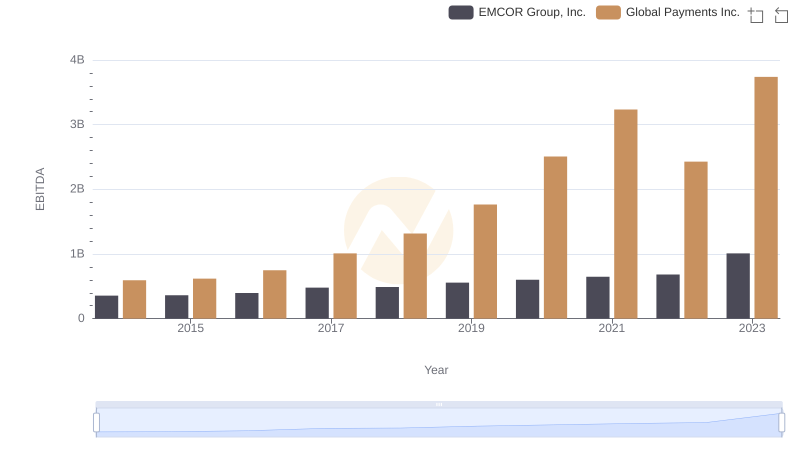
A Side-by-Side Analysis of EBITDA: Global Payments Inc. and EMCOR Group, Inc.
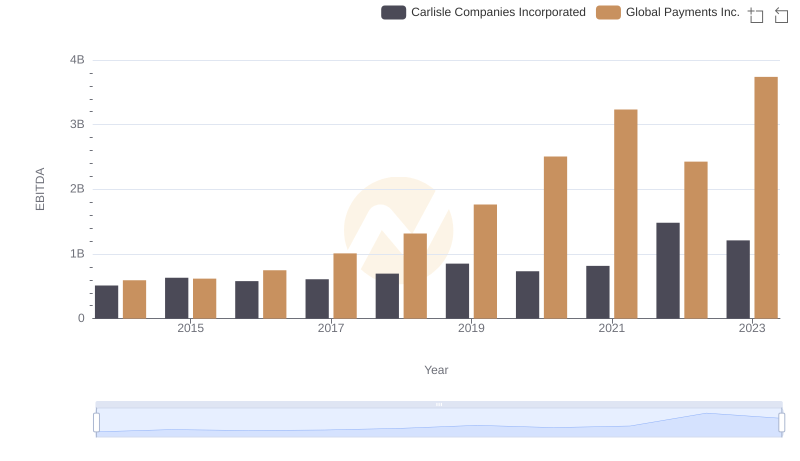
EBITDA Analysis: Evaluating Global Payments Inc. Against Carlisle Companies Incorporated
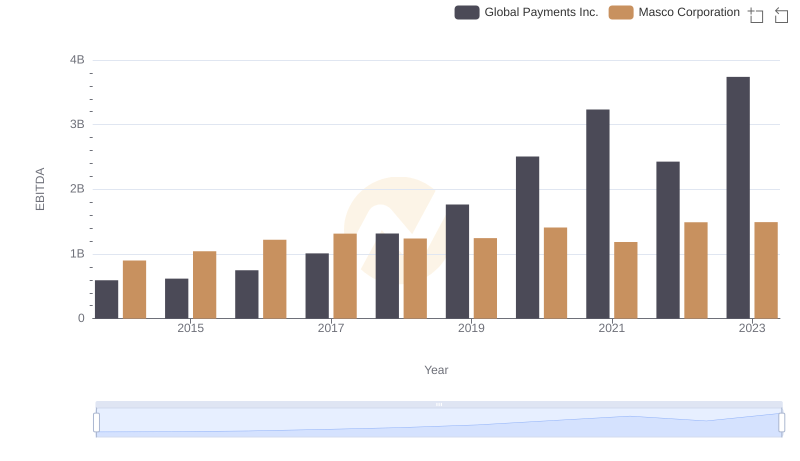
EBITDA Performance Review: Global Payments Inc. vs Masco Corporation
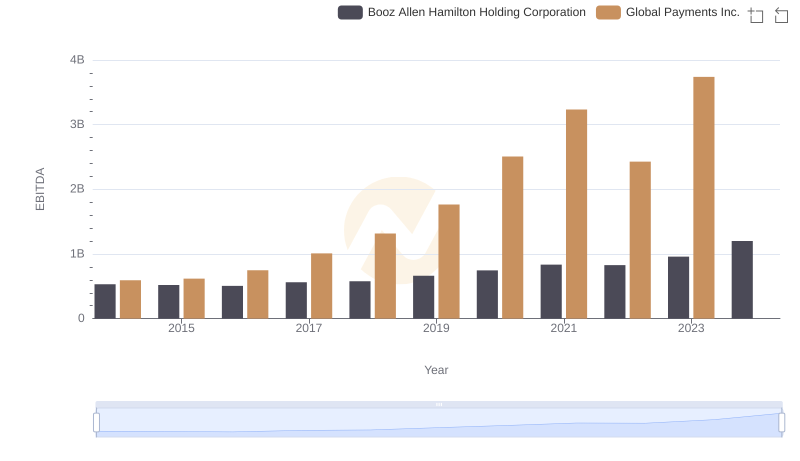
A Side-by-Side Analysis of EBITDA: Global Payments Inc. and Booz Allen Hamilton Holding Corporation