| __timestamp | Global Payments Inc. | Snap-on Incorporated |
|---|---|---|
| Wednesday, January 1, 2014 | 594102000 | 767600000 |
| Thursday, January 1, 2015 | 618109000 | 848900000 |
| Friday, January 1, 2016 | 748136000 | 942400000 |
| Sunday, January 1, 2017 | 1010019000 | 971900000 |
| Monday, January 1, 2018 | 1315968000 | 1057400000 |
| Tuesday, January 1, 2019 | 1764994000 | 1067000000 |
| Wednesday, January 1, 2020 | 2508393000 | 991400000 |
| Friday, January 1, 2021 | 3233589000 | 1249100000 |
| Saturday, January 1, 2022 | 2427684000 | 1351500000 |
| Sunday, January 1, 2023 | 3606789000 | 1478800000 |
| Monday, January 1, 2024 | 2333605000 | 1520700000 |
Cracking the code
In the ever-evolving landscape of financial services and manufacturing, Global Payments Inc. and Snap-on Incorporated have demonstrated remarkable EBITDA growth over the past decade. From 2014 to 2023, Global Payments Inc. has seen its EBITDA surge by over 530%, reflecting its strategic expansions and technological advancements. In contrast, Snap-on Incorporated, a stalwart in the manufacturing sector, has achieved a steady 93% increase, underscoring its resilience and consistent market demand.
These trends not only reflect the companies' individual strategies but also the broader economic shifts influencing their respective industries.
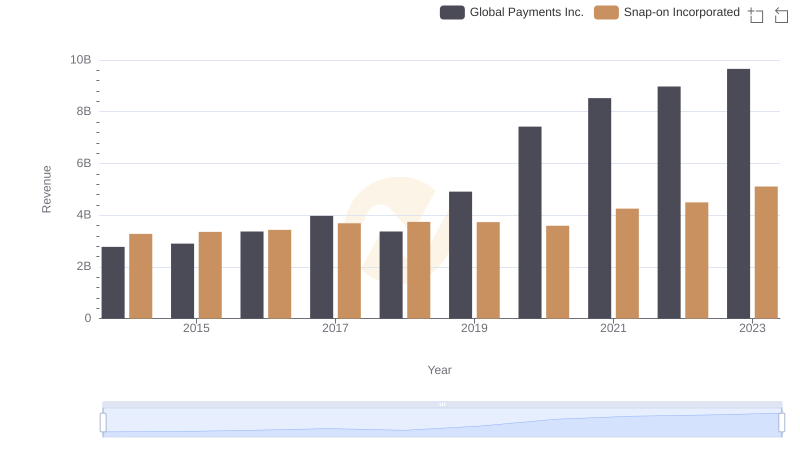
Global Payments Inc. vs Snap-on Incorporated: Examining Key Revenue Metrics
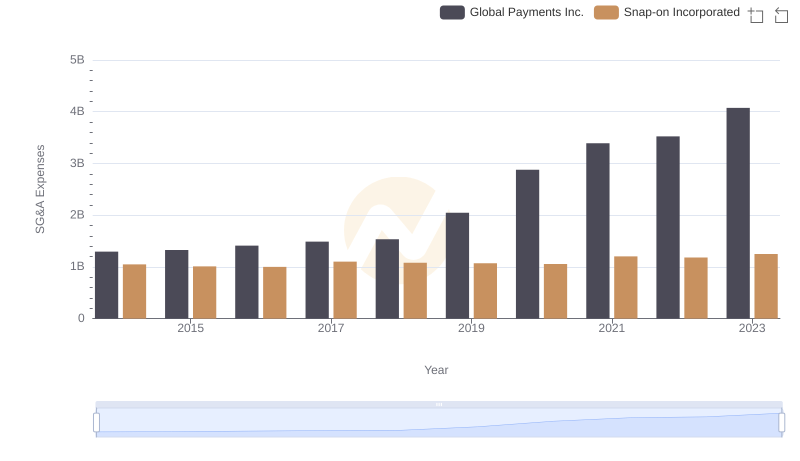
Operational Costs Compared: SG&A Analysis of Global Payments Inc. and Snap-on Incorporated
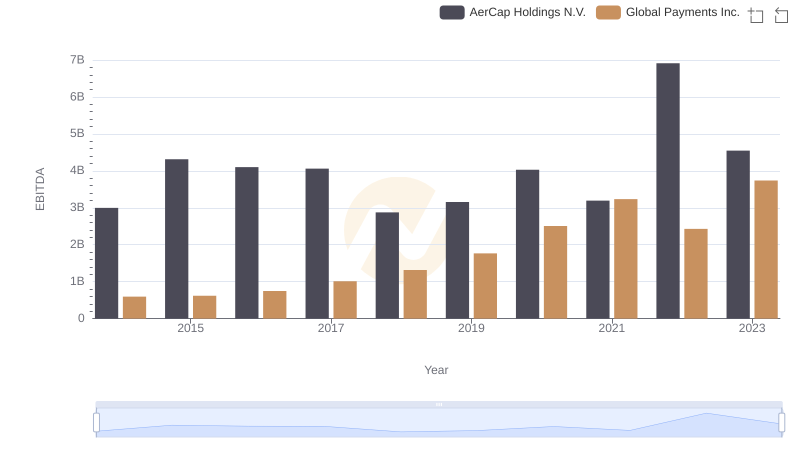
Global Payments Inc. and AerCap Holdings N.V.: A Detailed Examination of EBITDA Performance
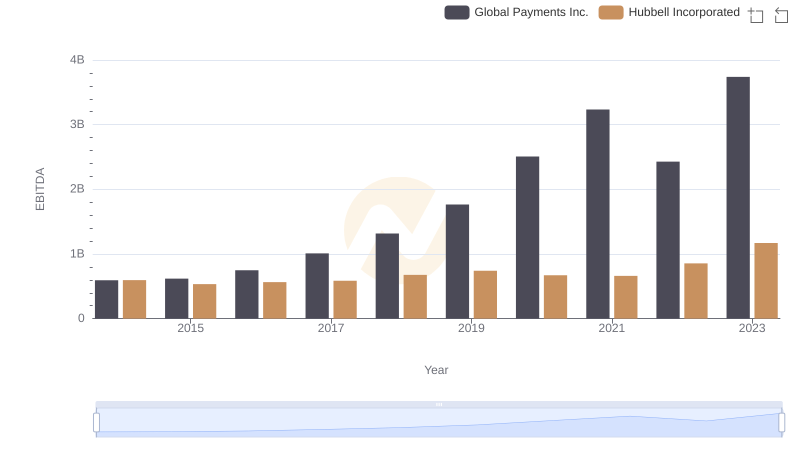
Comparative EBITDA Analysis: Global Payments Inc. vs Hubbell Incorporated
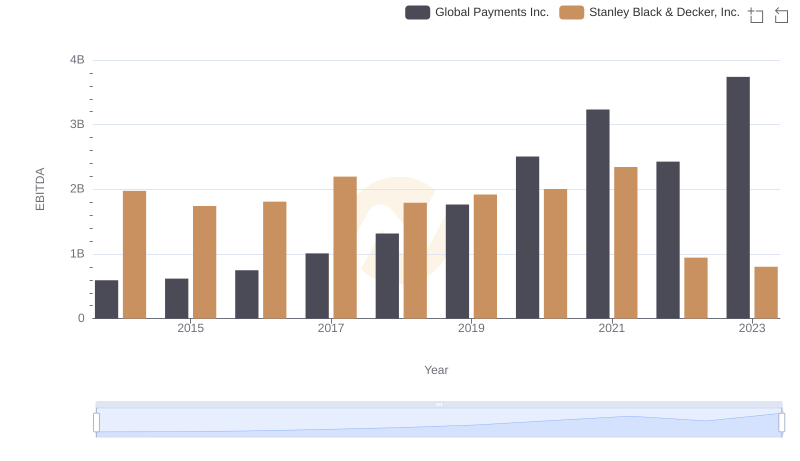
EBITDA Metrics Evaluated: Global Payments Inc. vs Stanley Black & Decker, Inc.
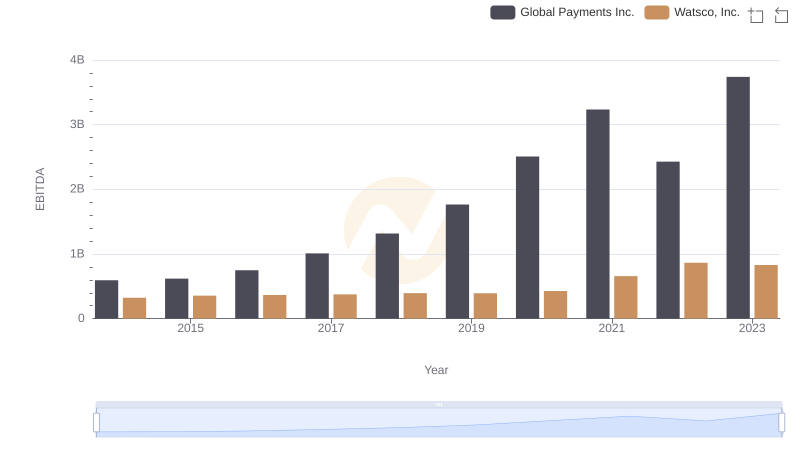
EBITDA Metrics Evaluated: Global Payments Inc. vs Watsco, Inc.
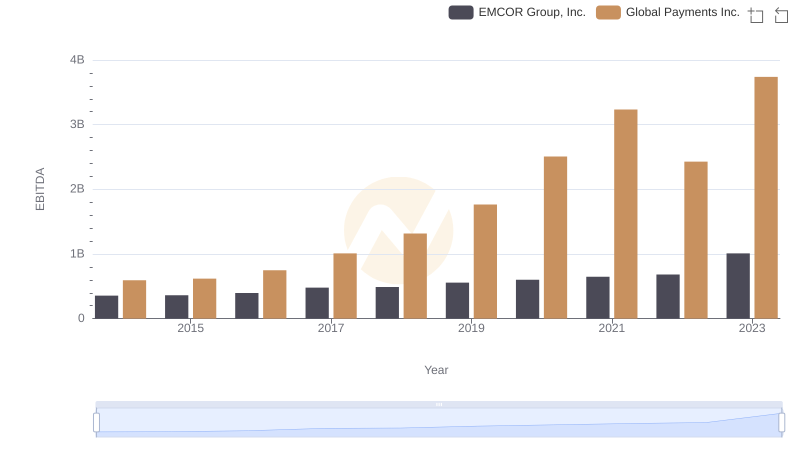
A Side-by-Side Analysis of EBITDA: Global Payments Inc. and EMCOR Group, Inc.

Global Payments Inc. vs TransUnion: In-Depth EBITDA Performance Comparison
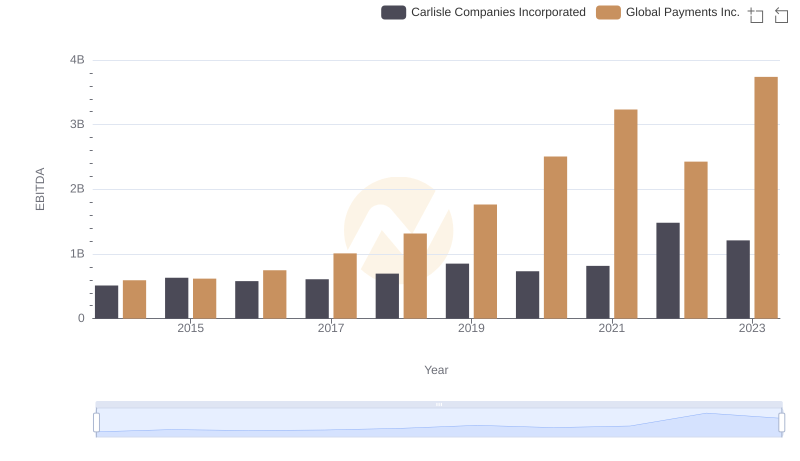
EBITDA Analysis: Evaluating Global Payments Inc. Against Carlisle Companies Incorporated