| __timestamp | Global Payments Inc. | Watsco, Inc. |
|---|---|---|
| Wednesday, January 1, 2014 | 594102000 | 323674000 |
| Thursday, January 1, 2015 | 618109000 | 355865000 |
| Friday, January 1, 2016 | 748136000 | 365698000 |
| Sunday, January 1, 2017 | 1010019000 | 375907000 |
| Monday, January 1, 2018 | 1315968000 | 394177000 |
| Tuesday, January 1, 2019 | 1764994000 | 391396000 |
| Wednesday, January 1, 2020 | 2508393000 | 426942000 |
| Friday, January 1, 2021 | 3233589000 | 656655000 |
| Saturday, January 1, 2022 | 2427684000 | 863261000 |
| Sunday, January 1, 2023 | 3606789000 | 829900000 |
| Monday, January 1, 2024 | 2333605000 | 781775000 |
Cracking the code
In the ever-evolving landscape of financial performance, Global Payments Inc. and Watsco, Inc. present a fascinating study in contrasts. Over the past decade, Global Payments Inc. has seen its EBITDA grow by an impressive 530%, starting from 2014 to 2023. This growth trajectory underscores the company's strategic prowess in the payments industry. In contrast, Watsco, Inc., a leader in HVAC distribution, has experienced a more modest EBITDA increase of approximately 156% over the same period.
These trends highlight the dynamic nature of financial performance across different sectors, offering valuable insights for investors and industry analysts alike.
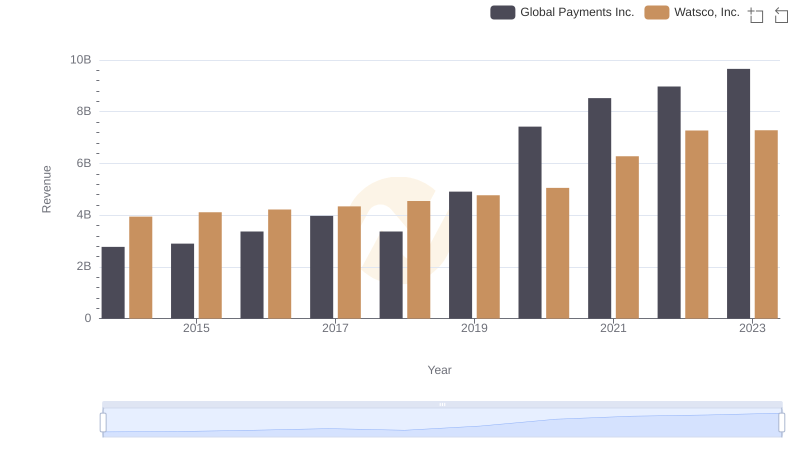
Revenue Showdown: Global Payments Inc. vs Watsco, Inc.
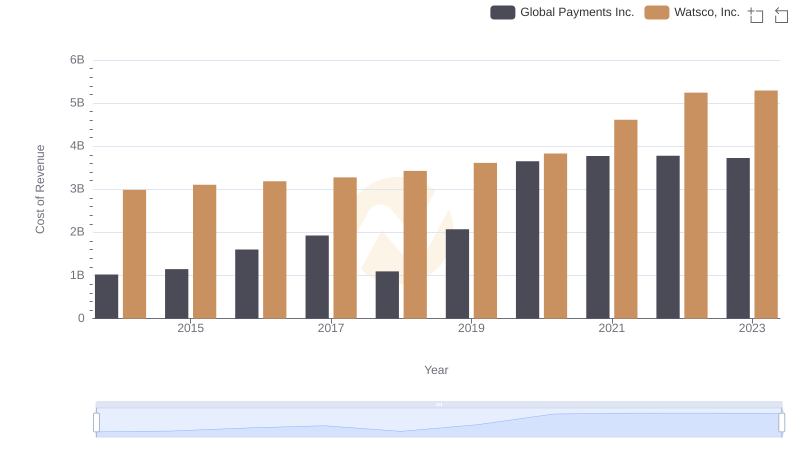
Global Payments Inc. vs Watsco, Inc.: Efficiency in Cost of Revenue Explored
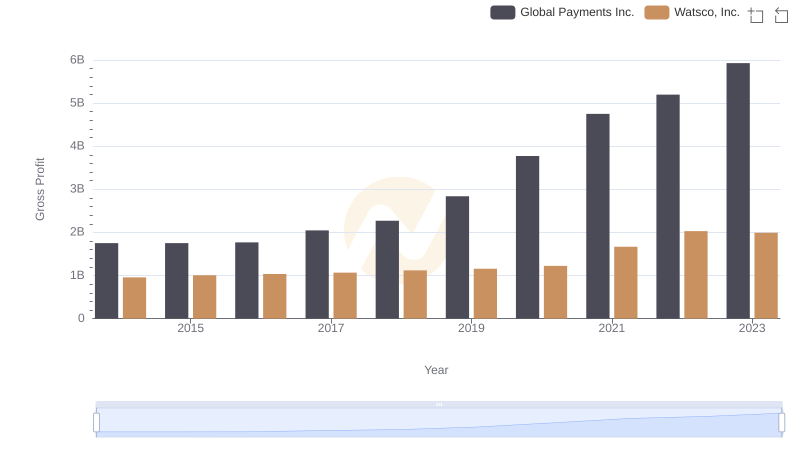
Gross Profit Comparison: Global Payments Inc. and Watsco, Inc. Trends
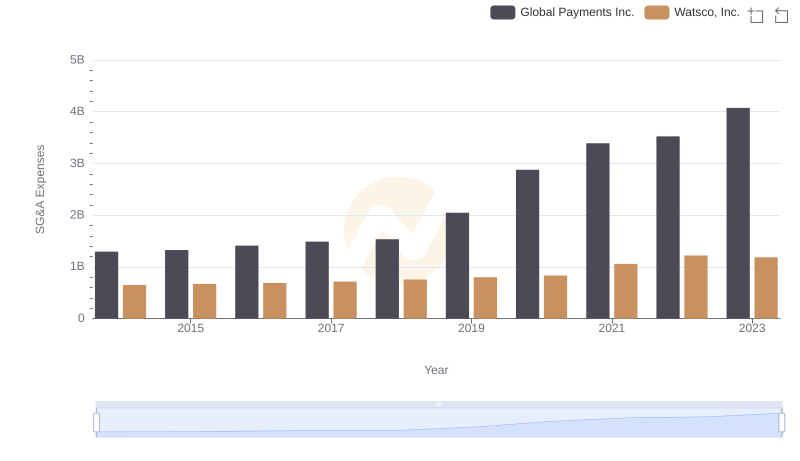
Global Payments Inc. vs Watsco, Inc.: SG&A Expense Trends
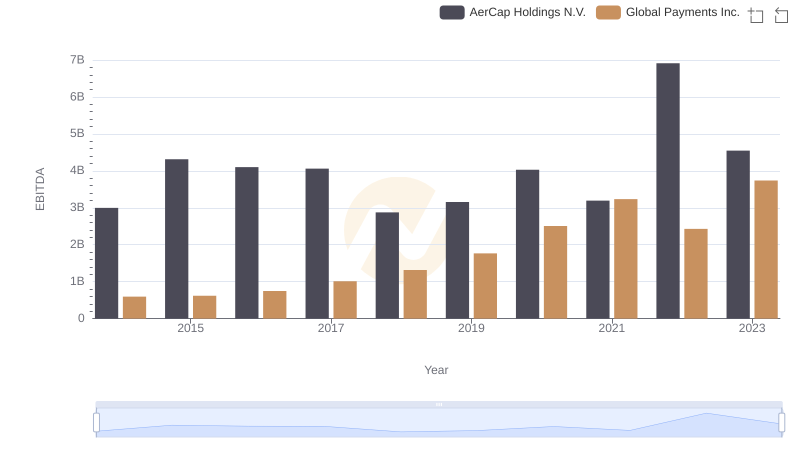
Global Payments Inc. and AerCap Holdings N.V.: A Detailed Examination of EBITDA Performance
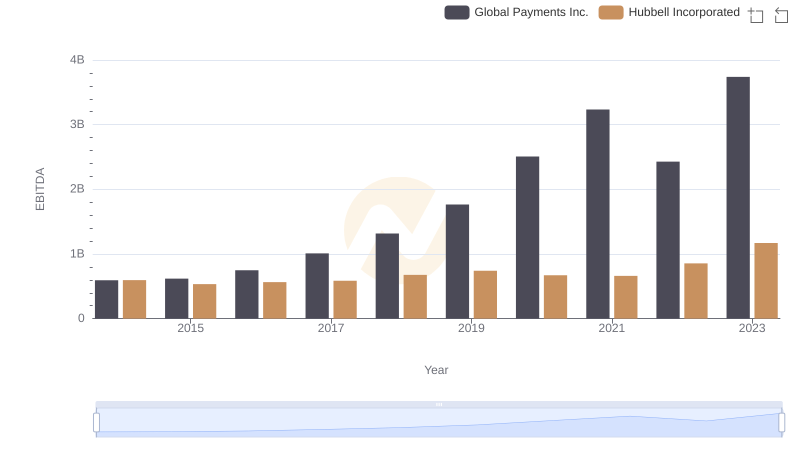
Comparative EBITDA Analysis: Global Payments Inc. vs Hubbell Incorporated
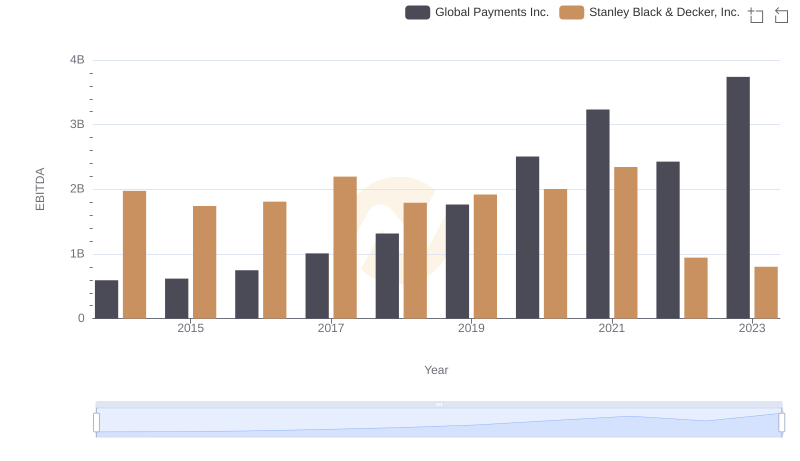
EBITDA Metrics Evaluated: Global Payments Inc. vs Stanley Black & Decker, Inc.
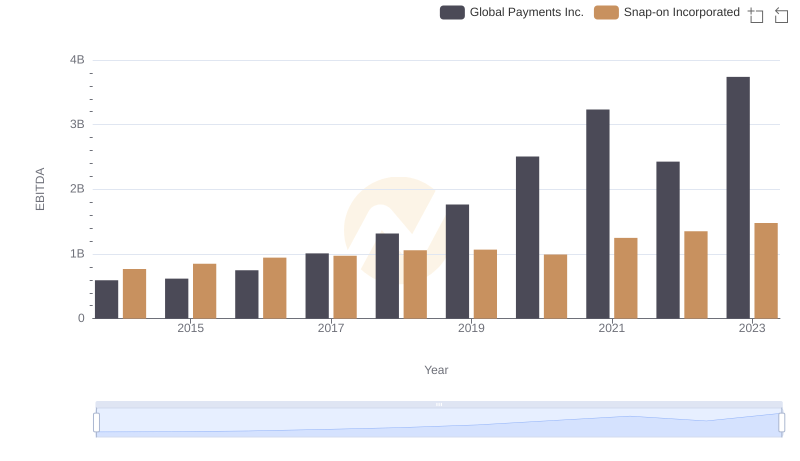
EBITDA Metrics Evaluated: Global Payments Inc. vs Snap-on Incorporated
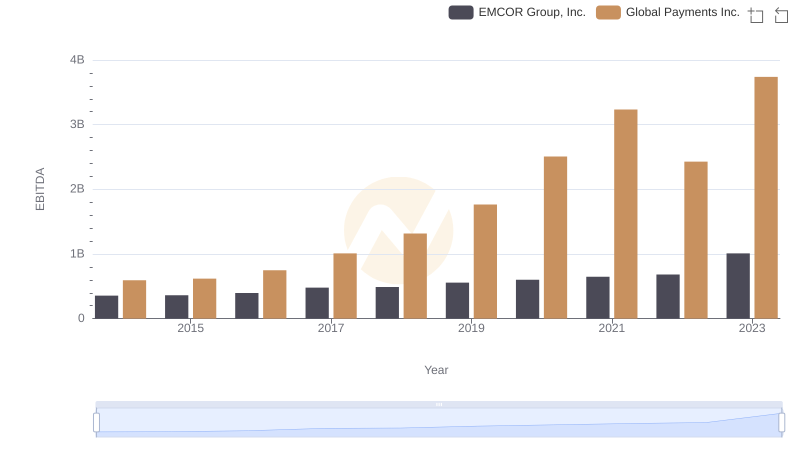
A Side-by-Side Analysis of EBITDA: Global Payments Inc. and EMCOR Group, Inc.

Global Payments Inc. vs TransUnion: In-Depth EBITDA Performance Comparison
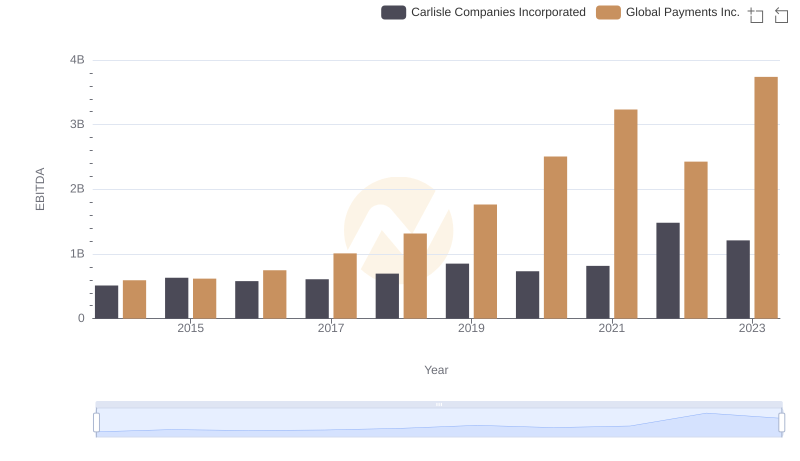
EBITDA Analysis: Evaluating Global Payments Inc. Against Carlisle Companies Incorporated