| __timestamp | Global Payments Inc. | J.B. Hunt Transport Services, Inc. |
|---|---|---|
| Wednesday, January 1, 2014 | 594102000 | 926038000 |
| Thursday, January 1, 2015 | 618109000 | 1055307000 |
| Friday, January 1, 2016 | 748136000 | 1082601000 |
| Sunday, January 1, 2017 | 1010019000 | 1007307000 |
| Monday, January 1, 2018 | 1315968000 | 1116914000 |
| Tuesday, January 1, 2019 | 1764994000 | 1274241000 |
| Wednesday, January 1, 2020 | 2508393000 | 713119000 |
| Friday, January 1, 2021 | 3233589000 | 1045530000 |
| Saturday, January 1, 2022 | 2427684000 | 1331553000 |
| Sunday, January 1, 2023 | 3606789000 | 1738774000 |
| Monday, January 1, 2024 | 2333605000 |
Igniting the spark of knowledge
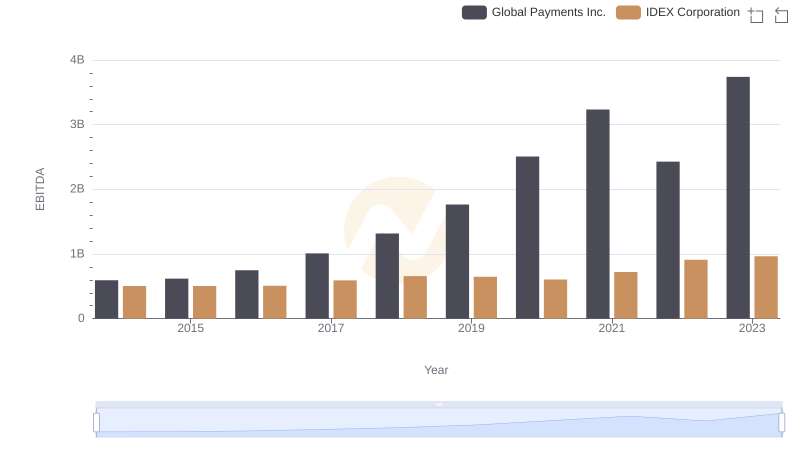
In the ever-evolving landscape of corporate finance, EBITDA serves as a crucial metric for assessing a company's operational performance. Over the past decade, Global Payments Inc. and J.B. Hunt Transport Services, Inc. have demonstrated contrasting trajectories in their EBITDA growth.
From 2014 to 2023, Global Payments Inc. has seen a remarkable increase of over 530% in EBITDA, peaking in 2023. This growth underscores the company's strategic expansions and operational efficiencies. In contrast, J.B. Hunt Transport Services, Inc. experienced a more modest growth of approximately 88% over the same period, reflecting steady but less aggressive expansion.
The data highlights the dynamic nature of these industries, with Global Payments Inc. capitalizing on digital payment trends, while J.B. Hunt continues to navigate the complexities of the transportation sector.
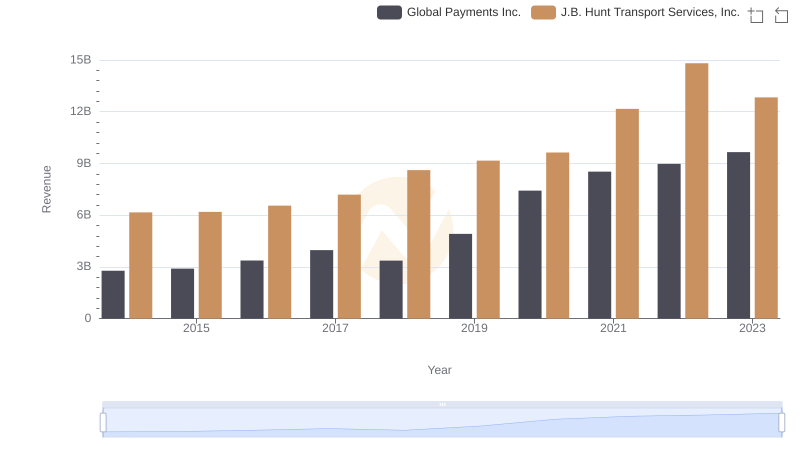
Global Payments Inc. or J.B. Hunt Transport Services, Inc.: Who Leads in Yearly Revenue?
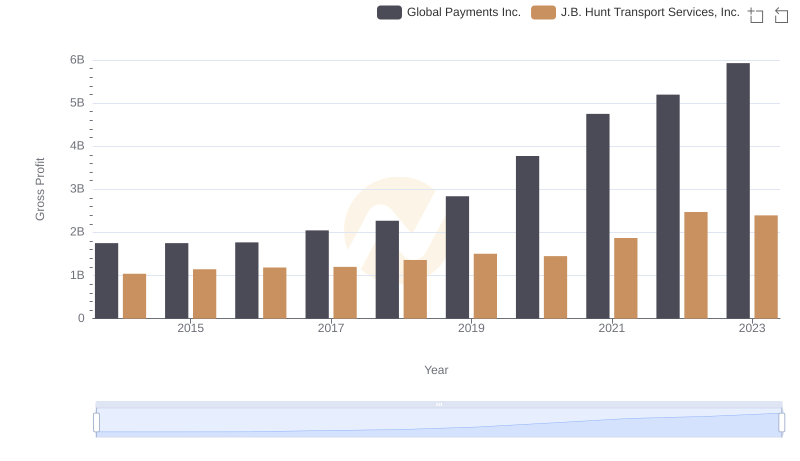
Global Payments Inc. vs J.B. Hunt Transport Services, Inc.: A Gross Profit Performance Breakdown

Global Payments Inc. vs TransUnion: In-Depth EBITDA Performance Comparison

Global Payments Inc. vs J.B. Hunt Transport Services, Inc.: SG&A Expense Trends
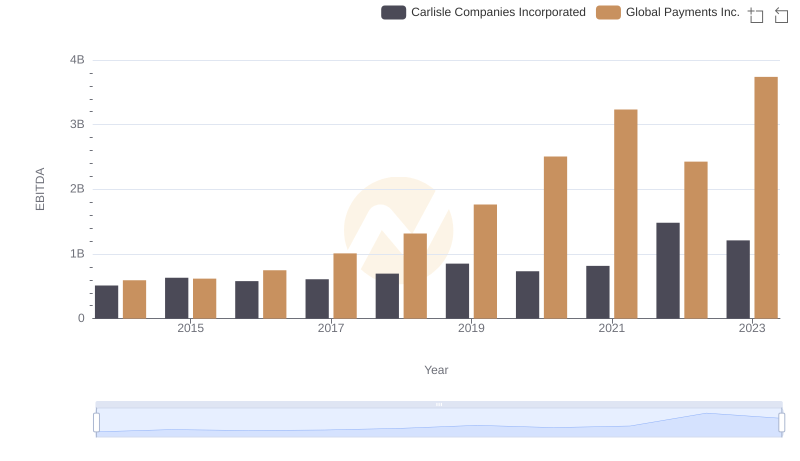
EBITDA Analysis: Evaluating Global Payments Inc. Against Carlisle Companies Incorporated
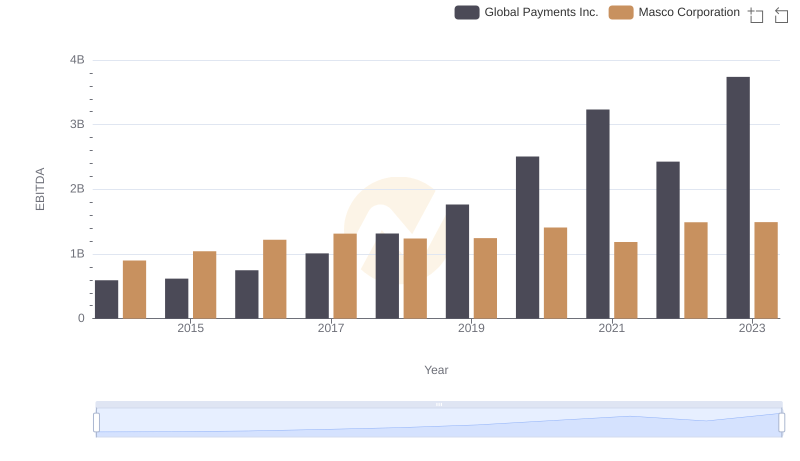
EBITDA Performance Review: Global Payments Inc. vs Masco Corporation
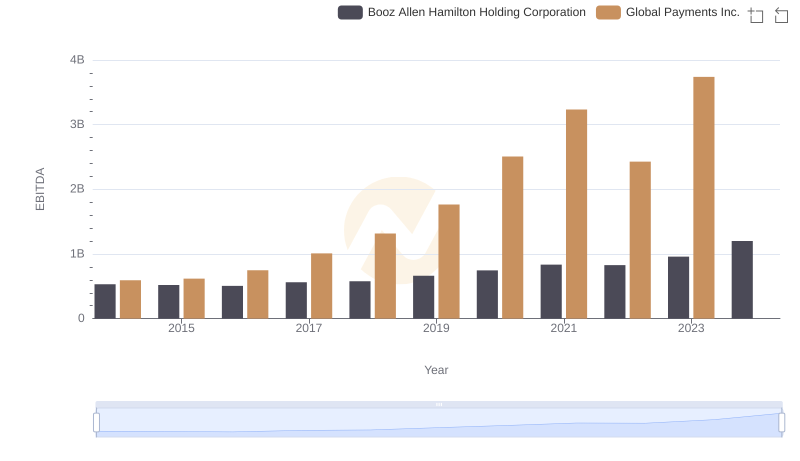
A Side-by-Side Analysis of EBITDA: Global Payments Inc. and Booz Allen Hamilton Holding Corporation
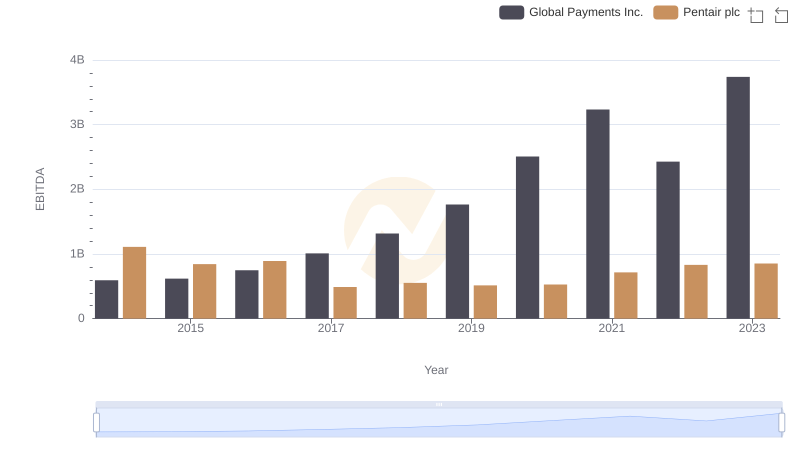
Professional EBITDA Benchmarking: Global Payments Inc. vs Pentair plc
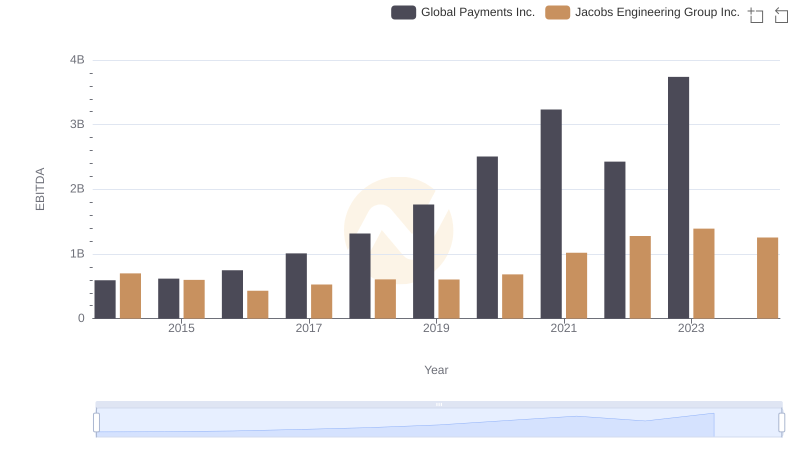
EBITDA Analysis: Evaluating Global Payments Inc. Against Jacobs Engineering Group Inc.
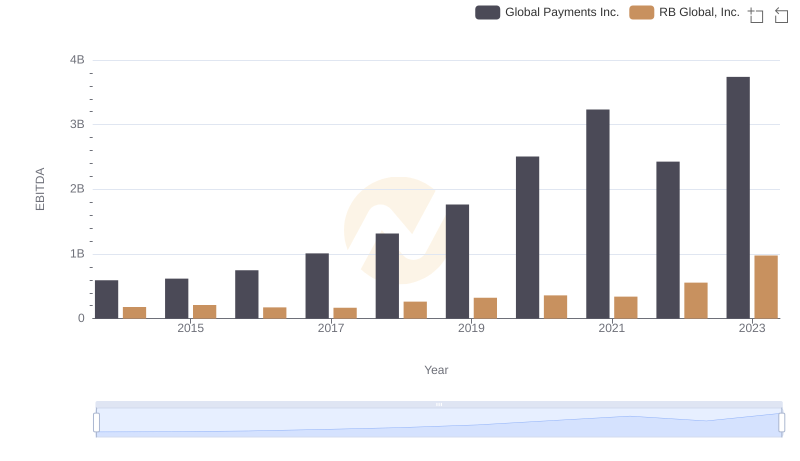
Comprehensive EBITDA Comparison: Global Payments Inc. vs RB Global, Inc.
Global Payments Inc. vs IDEX Corporation: In-Depth EBITDA Performance Comparison