| __timestamp | EMCOR Group, Inc. | Global Payments Inc. |
|---|---|---|
| Wednesday, January 1, 2014 | 355858000 | 594102000 |
| Thursday, January 1, 2015 | 362095000 | 618109000 |
| Friday, January 1, 2016 | 395913000 | 748136000 |
| Sunday, January 1, 2017 | 478459000 | 1010019000 |
| Monday, January 1, 2018 | 489954000 | 1315968000 |
| Tuesday, January 1, 2019 | 556055000 | 1764994000 |
| Wednesday, January 1, 2020 | 601449000 | 2508393000 |
| Friday, January 1, 2021 | 646861000 | 3233589000 |
| Saturday, January 1, 2022 | 682399000 | 2427684000 |
| Sunday, January 1, 2023 | 1009017000 | 3606789000 |
| Monday, January 1, 2024 | 2333605000 |
Unleashing insights
In the ever-evolving landscape of financial performance, EBITDA serves as a crucial indicator of a company's operational efficiency. Over the past decade, Global Payments Inc. and EMCOR Group, Inc. have demonstrated remarkable growth in this metric. From 2014 to 2023, Global Payments Inc. saw its EBITDA surge by over 500%, peaking in 2023. This growth reflects the company's strategic expansions and acquisitions, positioning it as a leader in the payment processing industry.
Conversely, EMCOR Group, Inc. experienced a steady increase of approximately 180% in EBITDA over the same period, highlighting its resilience and adaptability in the construction and facilities services sector. The year 2023 marked a significant milestone for both companies, with EMCOR achieving its highest EBITDA, while Global Payments continued to dominate with a figure nearly four times larger. This side-by-side analysis underscores the diverse strategies and market dynamics shaping these industry giants.
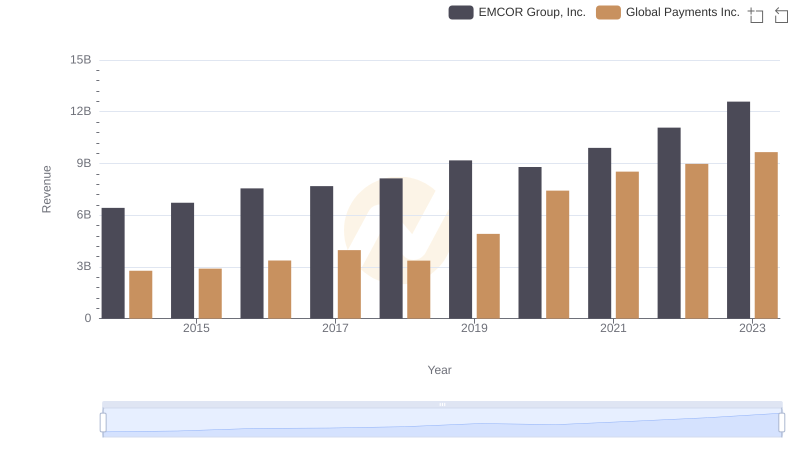
Comparing Revenue Performance: Global Payments Inc. or EMCOR Group, Inc.?

Global Payments Inc. vs EMCOR Group, Inc.: Efficiency in Cost of Revenue Explored
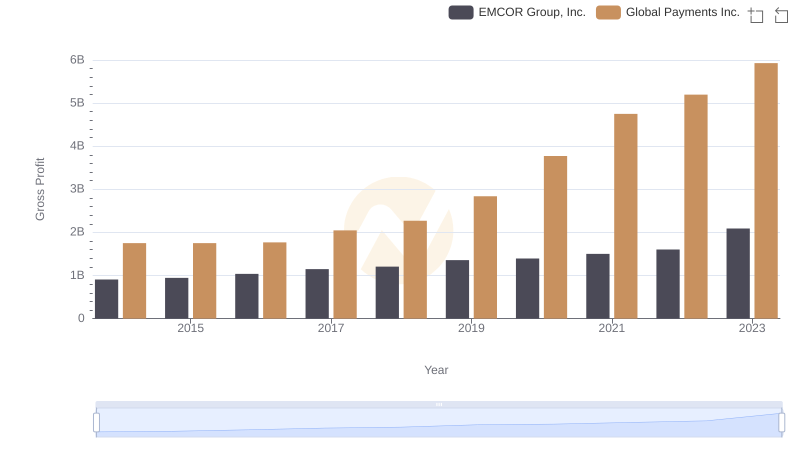
Key Insights on Gross Profit: Global Payments Inc. vs EMCOR Group, Inc.
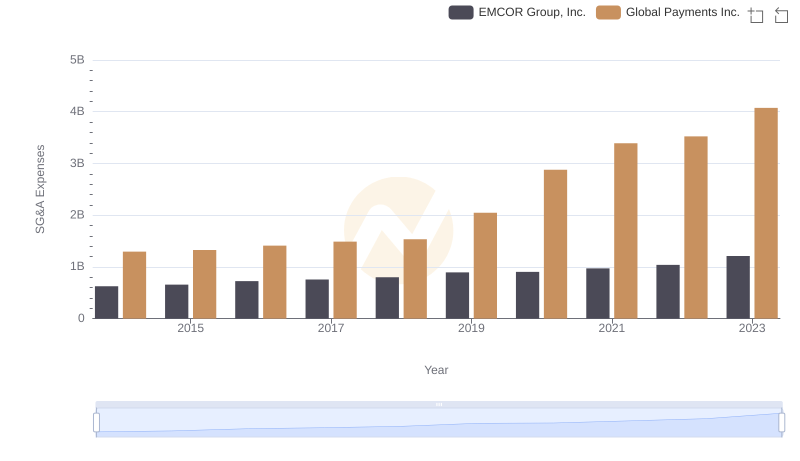
Comparing SG&A Expenses: Global Payments Inc. vs EMCOR Group, Inc. Trends and Insights
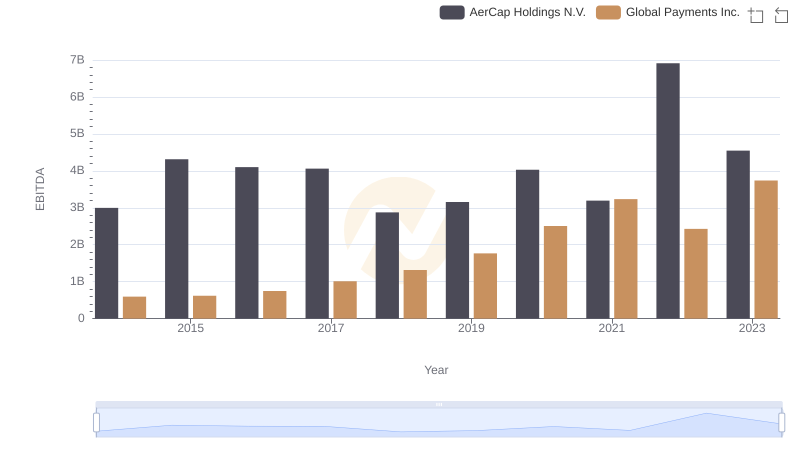
Global Payments Inc. and AerCap Holdings N.V.: A Detailed Examination of EBITDA Performance
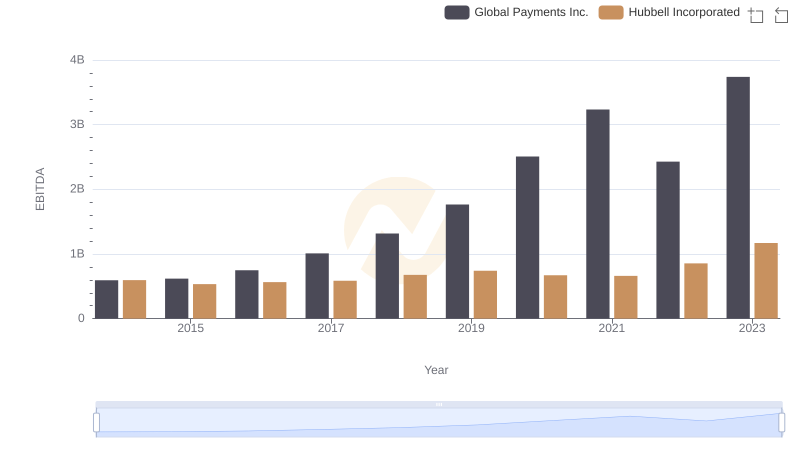
Comparative EBITDA Analysis: Global Payments Inc. vs Hubbell Incorporated
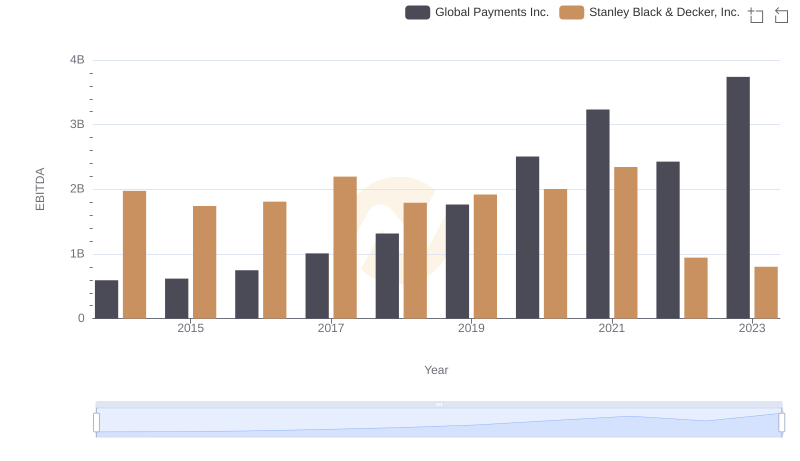
EBITDA Metrics Evaluated: Global Payments Inc. vs Stanley Black & Decker, Inc.
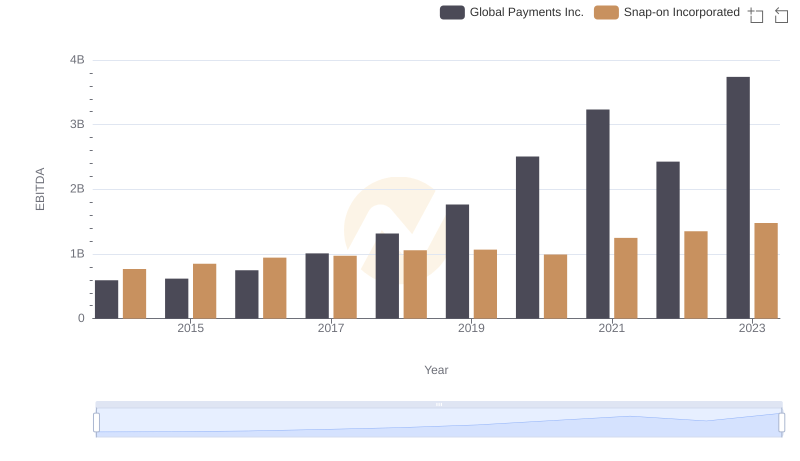
EBITDA Metrics Evaluated: Global Payments Inc. vs Snap-on Incorporated
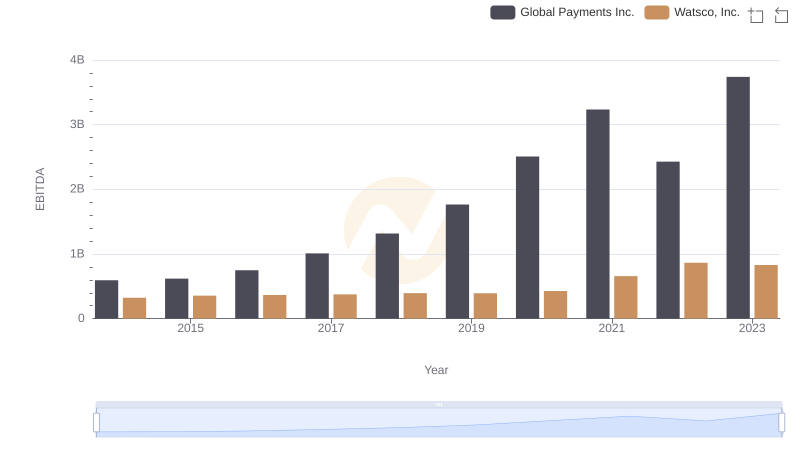
EBITDA Metrics Evaluated: Global Payments Inc. vs Watsco, Inc.

Global Payments Inc. vs TransUnion: In-Depth EBITDA Performance Comparison
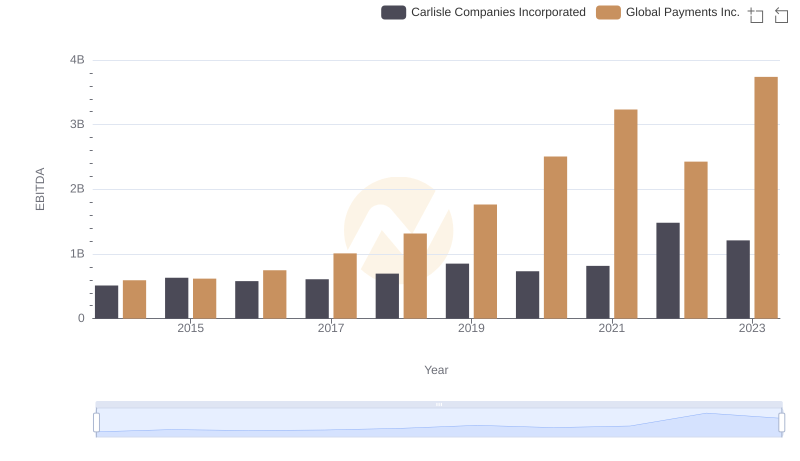
EBITDA Analysis: Evaluating Global Payments Inc. Against Carlisle Companies Incorporated