| __timestamp | Global Payments Inc. | Masco Corporation |
|---|---|---|
| Wednesday, January 1, 2014 | 1751611000 | 2387000000 |
| Thursday, January 1, 2015 | 1750511000 | 2253000000 |
| Friday, January 1, 2016 | 1767444000 | 2456000000 |
| Sunday, January 1, 2017 | 2047126000 | 2611000000 |
| Monday, January 1, 2018 | 2271352000 | 2689000000 |
| Tuesday, January 1, 2019 | 2838089000 | 2371000000 |
| Wednesday, January 1, 2020 | 3772831000 | 2587000000 |
| Friday, January 1, 2021 | 4750037000 | 2863000000 |
| Saturday, January 1, 2022 | 5196898000 | 2713000000 |
| Sunday, January 1, 2023 | 5926898000 | 2836000000 |
| Monday, January 1, 2024 | 6345778000 | 2831000000 |
In pursuit of knowledge
In the ever-evolving landscape of global finance and industry, two giants, Global Payments Inc. and Masco Corporation, have showcased remarkable trends over the past decade. From 2014 to 2023, Global Payments Inc. has seen its gross profit soar by approximately 238%, reflecting its strategic expansions and technological advancements. In contrast, Masco Corporation, a leader in home improvement and building products, has maintained a steady growth trajectory, with a 19% increase in gross profit over the same period.
These trends not only highlight the dynamic nature of these industries but also offer a glimpse into the strategic maneuvers that have propelled these companies forward.
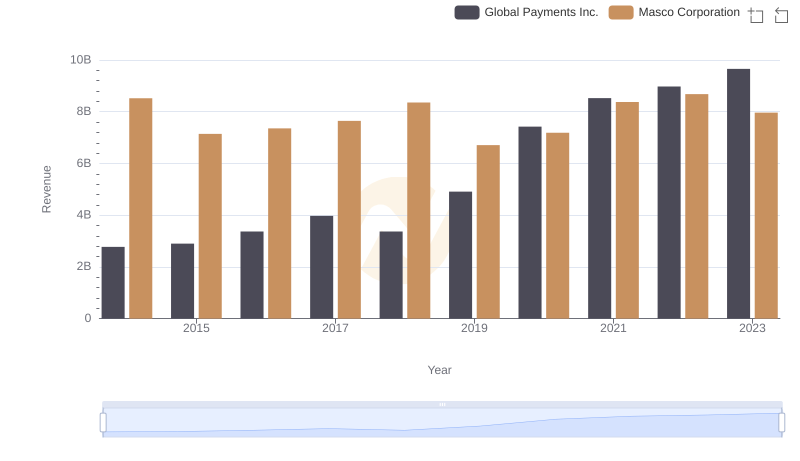
Global Payments Inc. vs Masco Corporation: Examining Key Revenue Metrics
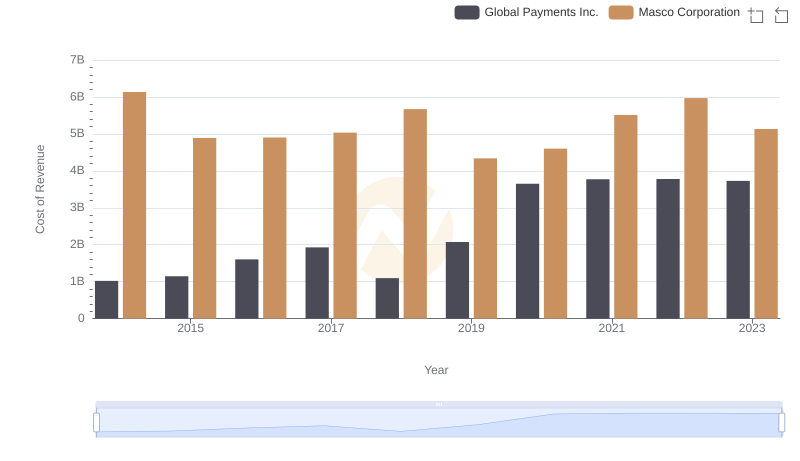
Analyzing Cost of Revenue: Global Payments Inc. and Masco Corporation
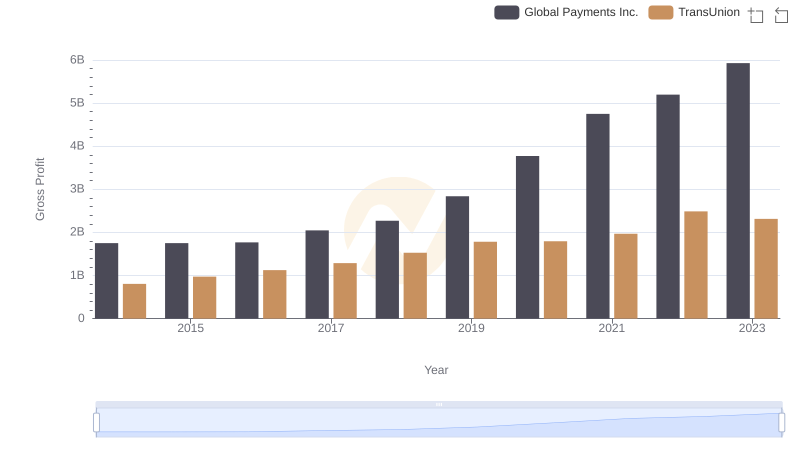
Global Payments Inc. and TransUnion: A Detailed Gross Profit Analysis
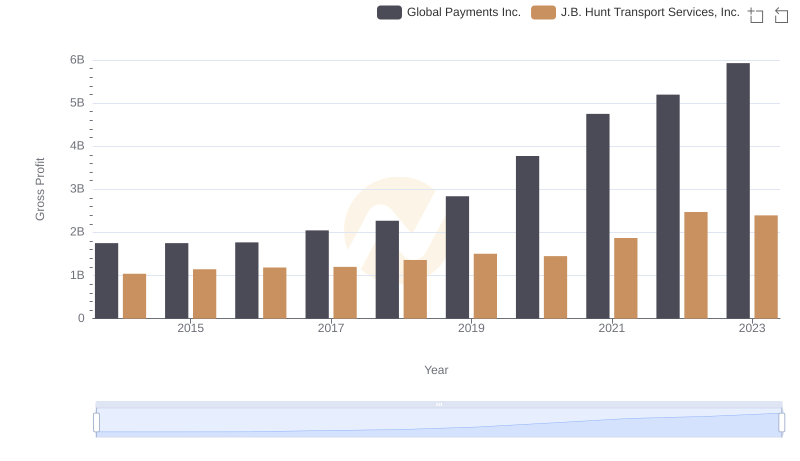
Global Payments Inc. vs J.B. Hunt Transport Services, Inc.: A Gross Profit Performance Breakdown
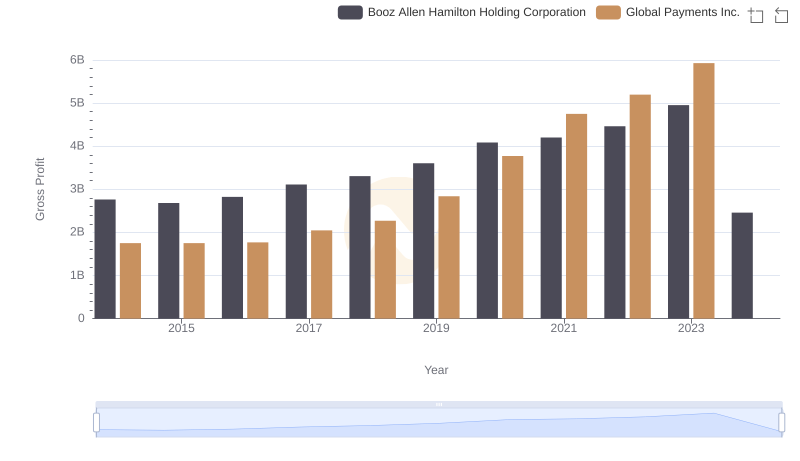
Gross Profit Analysis: Comparing Global Payments Inc. and Booz Allen Hamilton Holding Corporation
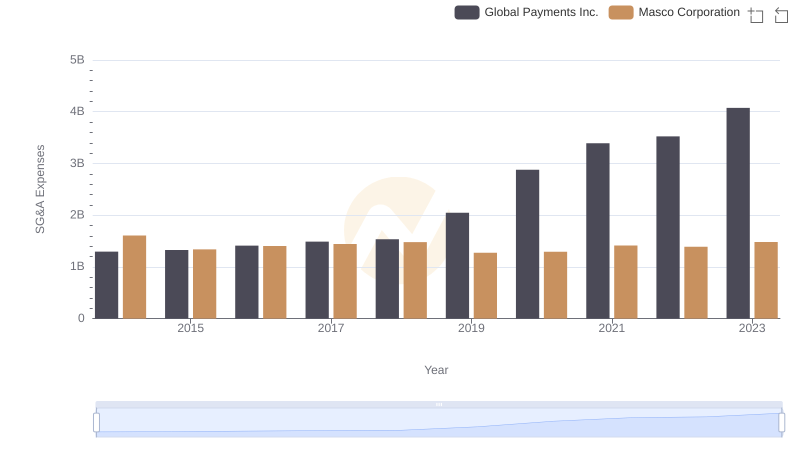
Breaking Down SG&A Expenses: Global Payments Inc. vs Masco Corporation
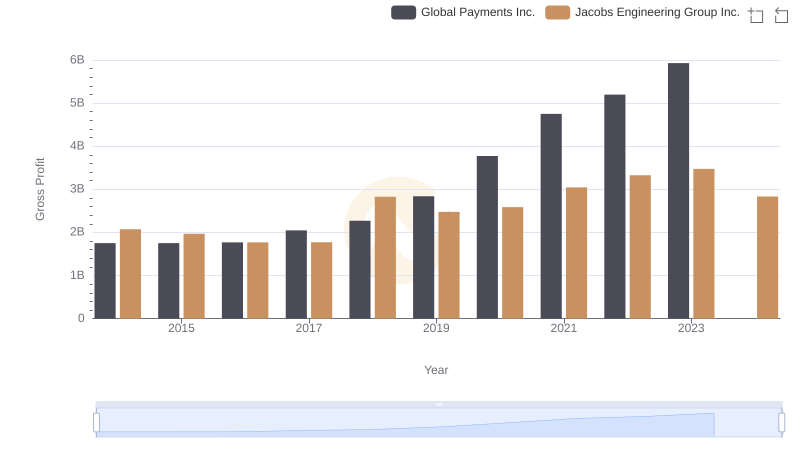
Global Payments Inc. vs Jacobs Engineering Group Inc.: A Gross Profit Performance Breakdown
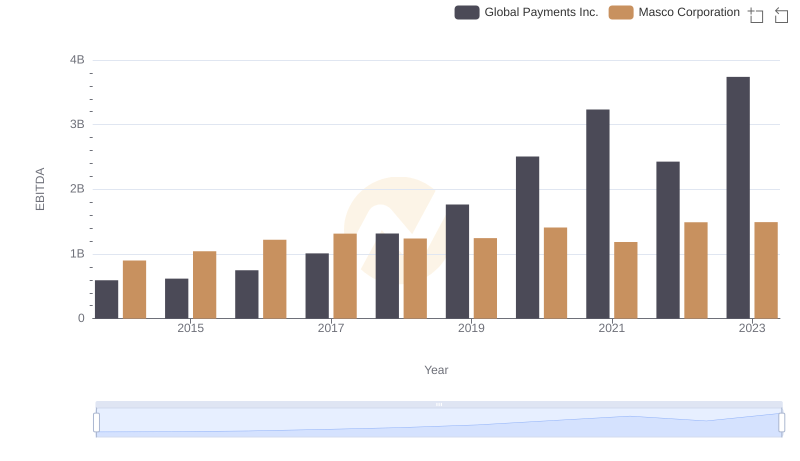
EBITDA Performance Review: Global Payments Inc. vs Masco Corporation