| __timestamp | Global Payments Inc. | Masco Corporation |
|---|---|---|
| Wednesday, January 1, 2014 | 1022107000 | 6134000000 |
| Thursday, January 1, 2015 | 1147639000 | 4889000000 |
| Friday, January 1, 2016 | 1603532000 | 4901000000 |
| Sunday, January 1, 2017 | 1928037000 | 5033000000 |
| Monday, January 1, 2018 | 1095014000 | 5670000000 |
| Tuesday, January 1, 2019 | 2073803000 | 4336000000 |
| Wednesday, January 1, 2020 | 3650727000 | 4601000000 |
| Friday, January 1, 2021 | 3773725000 | 5512000000 |
| Saturday, January 1, 2022 | 3778617000 | 5967000000 |
| Sunday, January 1, 2023 | 3727521000 | 5131000000 |
| Monday, January 1, 2024 | 3760116000 | 4997000000 |
Unlocking the unknown
In the ever-evolving landscape of corporate finance, understanding the cost of revenue is crucial for assessing a company's efficiency and profitability. This analysis delves into the financial journeys of Global Payments Inc. and Masco Corporation from 2014 to 2023.
Global Payments Inc. has seen a remarkable increase in its cost of revenue, growing by approximately 265% over the decade. This surge reflects the company's aggressive expansion and investment in technology-driven payment solutions. In contrast, Masco Corporation, a leader in home improvement and building products, experienced a more modest 16% increase in its cost of revenue. This stability underscores Masco's consistent market presence and operational efficiency.
The data reveals a fascinating narrative of growth and stability, offering insights into how these industry leaders navigate their respective markets. As we look to the future, these trends provide a window into the strategic priorities of these corporations.
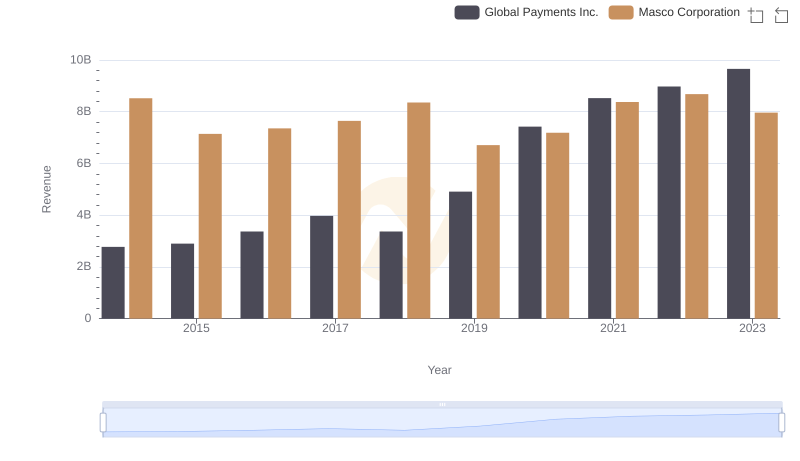
Global Payments Inc. vs Masco Corporation: Examining Key Revenue Metrics
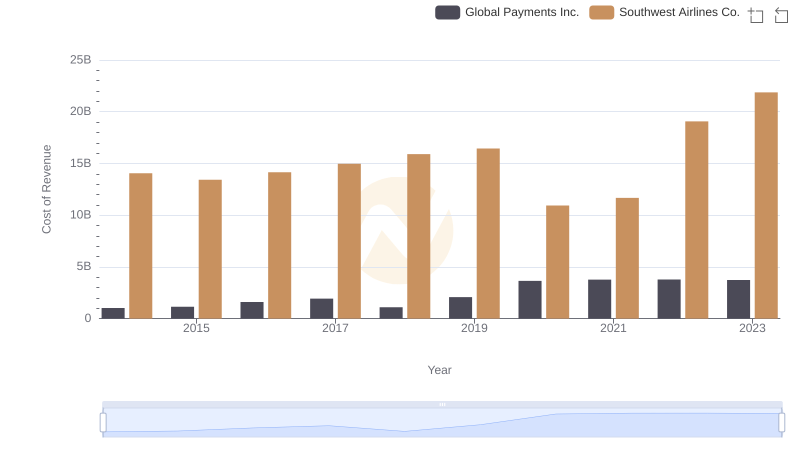
Analyzing Cost of Revenue: Global Payments Inc. and Southwest Airlines Co.
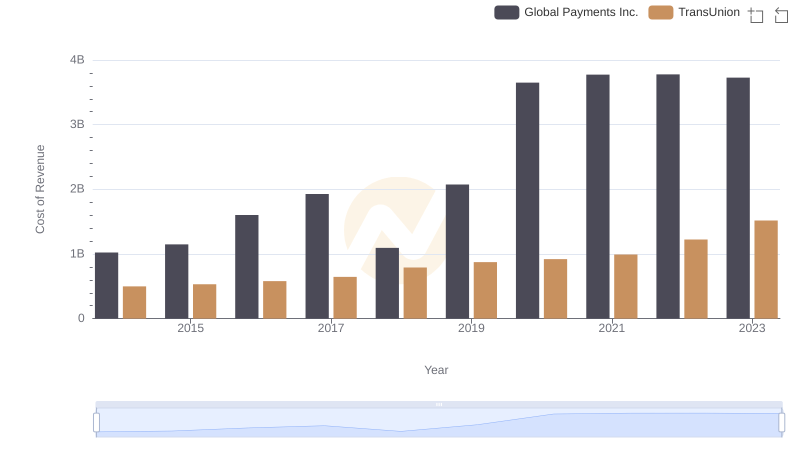
Cost of Revenue Trends: Global Payments Inc. vs TransUnion
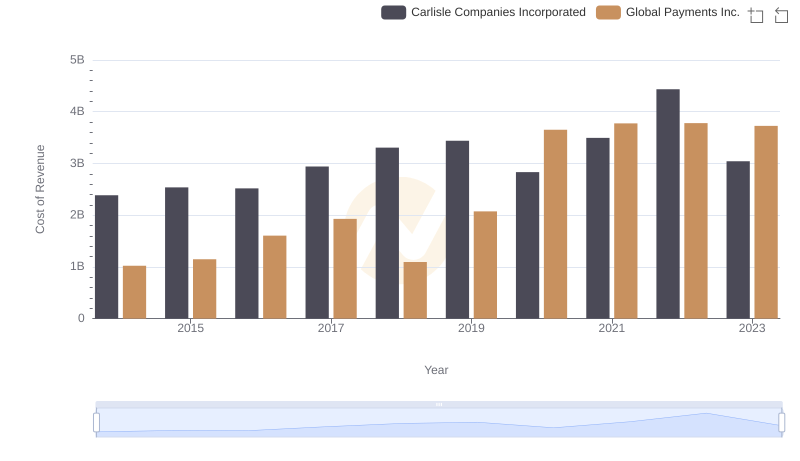
Cost of Revenue Comparison: Global Payments Inc. vs Carlisle Companies Incorporated
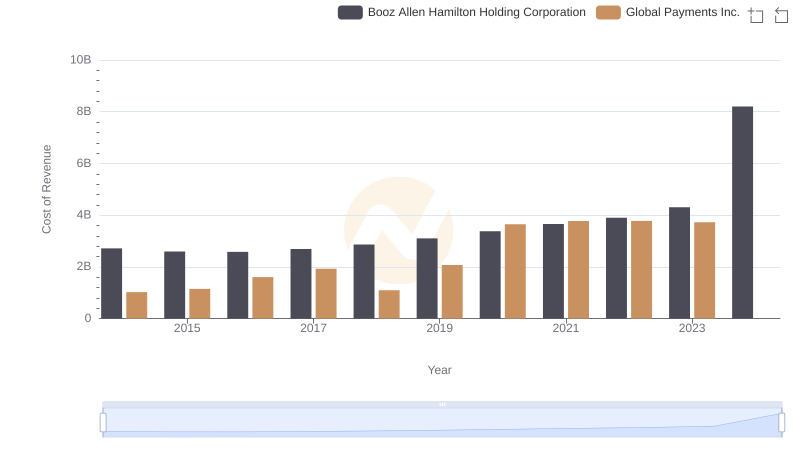
Comparing Cost of Revenue Efficiency: Global Payments Inc. vs Booz Allen Hamilton Holding Corporation
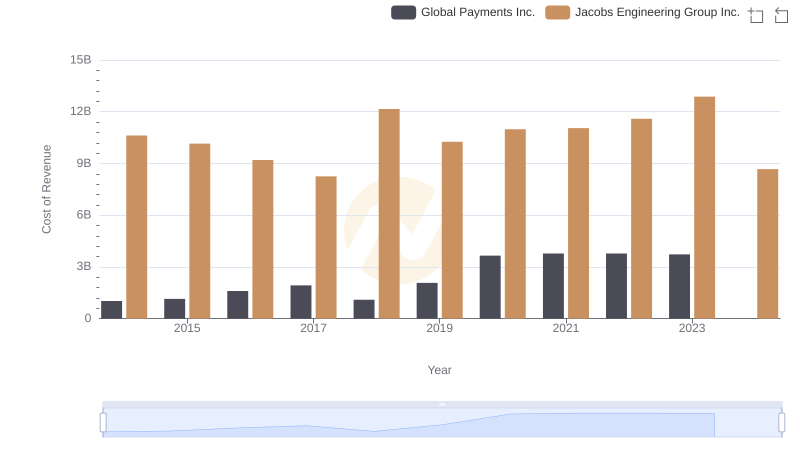
Cost Insights: Breaking Down Global Payments Inc. and Jacobs Engineering Group Inc.'s Expenses
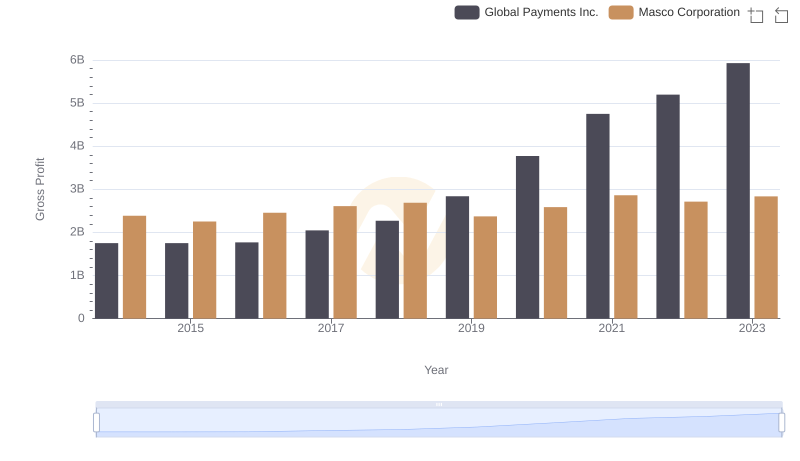
Gross Profit Comparison: Global Payments Inc. and Masco Corporation Trends
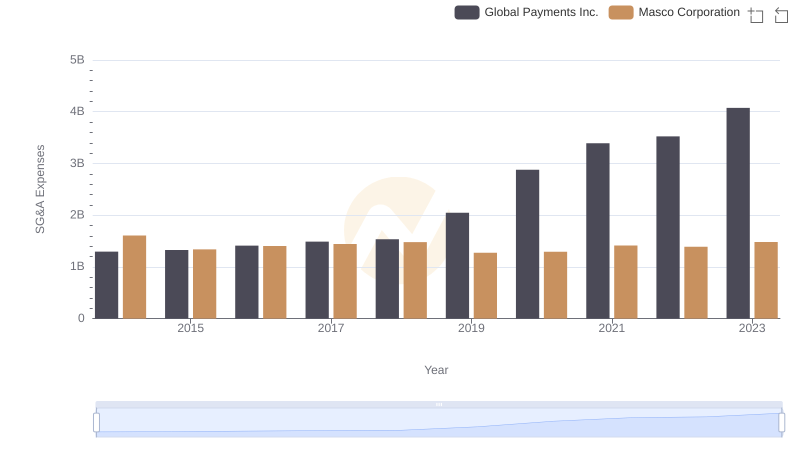
Breaking Down SG&A Expenses: Global Payments Inc. vs Masco Corporation
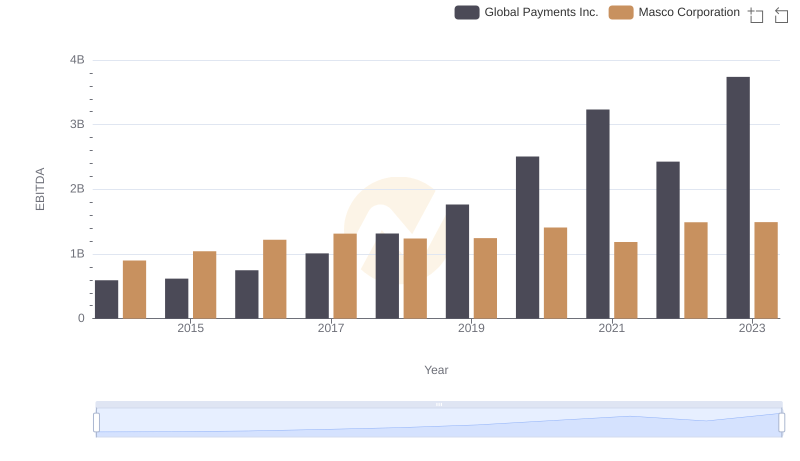
EBITDA Performance Review: Global Payments Inc. vs Masco Corporation