| __timestamp | EMCOR Group, Inc. | Rentokil Initial plc |
|---|---|---|
| Wednesday, January 1, 2014 | 907246000 | 1443300000 |
| Thursday, January 1, 2015 | 944479000 | 1448800000 |
| Friday, January 1, 2016 | 1037862000 | 1792000000 |
| Sunday, January 1, 2017 | 1147012000 | 1937400000 |
| Monday, January 1, 2018 | 1205453000 | 1958100000 |
| Tuesday, January 1, 2019 | 1355868000 | 577200000 |
| Wednesday, January 1, 2020 | 1395382000 | 653000000 |
| Friday, January 1, 2021 | 1501737000 | 714800000 |
| Saturday, January 1, 2022 | 1603594000 | 977000000 |
| Sunday, January 1, 2023 | 2089339000 | 4448000000 |
Unveiling the hidden dimensions of data
In the competitive world of industrial services, EMCOR Group, Inc. and Rentokil Initial plc have emerged as formidable players. Over the past decade, these companies have showcased their prowess in generating gross profit, a key indicator of financial health. From 2014 to 2023, Rentokil Initial plc consistently outperformed EMCOR, with a notable peak in 2023 where its gross profit was more than double that of EMCOR's. However, EMCOR demonstrated steady growth, increasing its gross profit by approximately 130% over the same period. This rivalry highlights the dynamic nature of the industry, where strategic decisions and market conditions can significantly impact financial outcomes. As we look to the future, the question remains: will EMCOR close the gap, or will Rentokil continue to lead the charge?
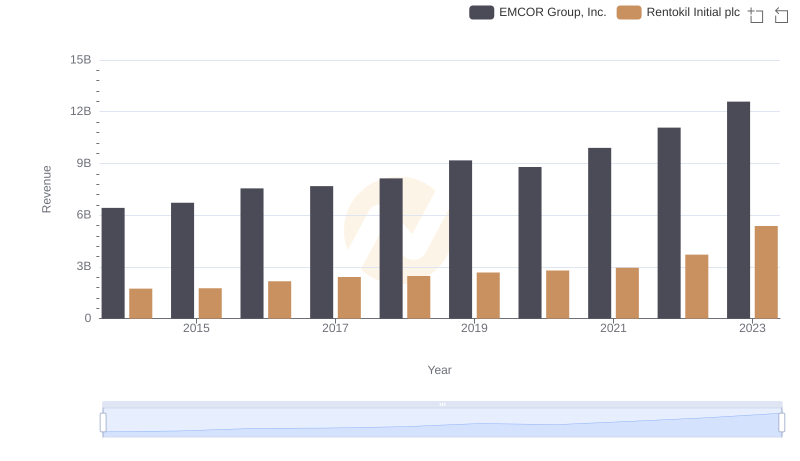
Who Generates More Revenue? EMCOR Group, Inc. or Rentokil Initial plc
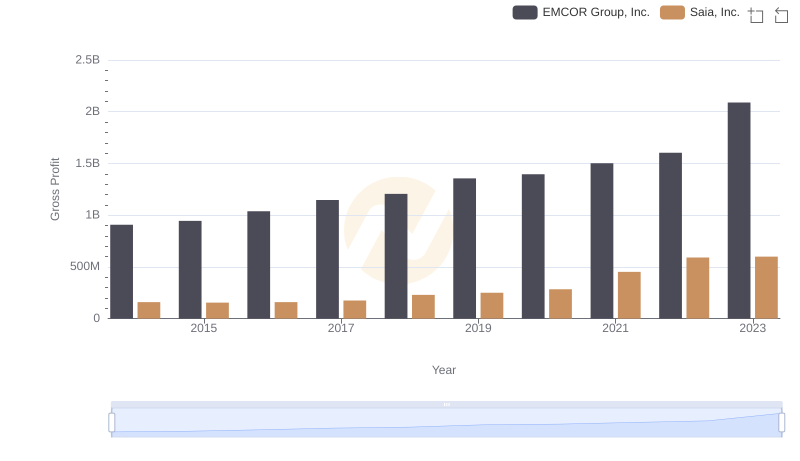
Gross Profit Trends Compared: EMCOR Group, Inc. vs Saia, Inc.
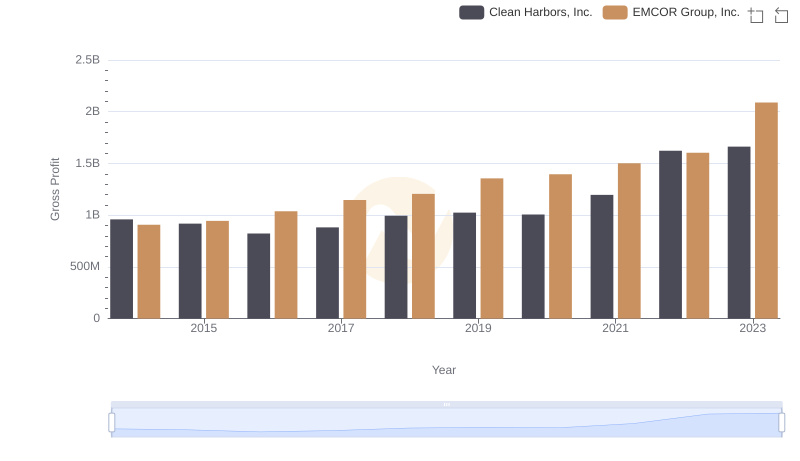
EMCOR Group, Inc. and Clean Harbors, Inc.: A Detailed Gross Profit Analysis
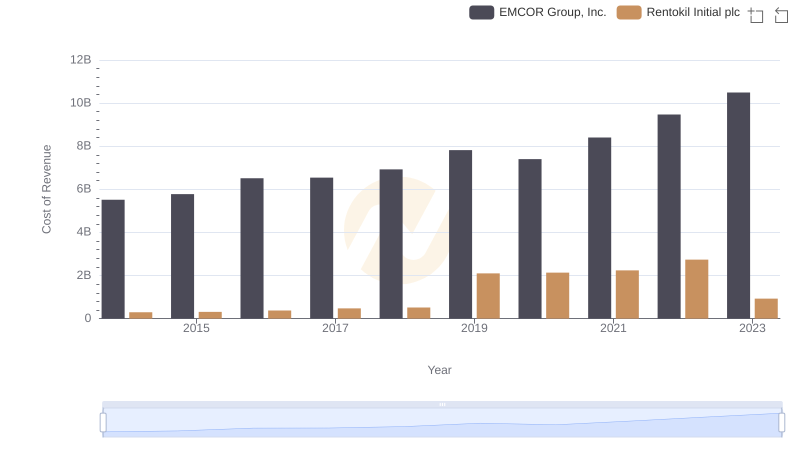
Analyzing Cost of Revenue: EMCOR Group, Inc. and Rentokil Initial plc
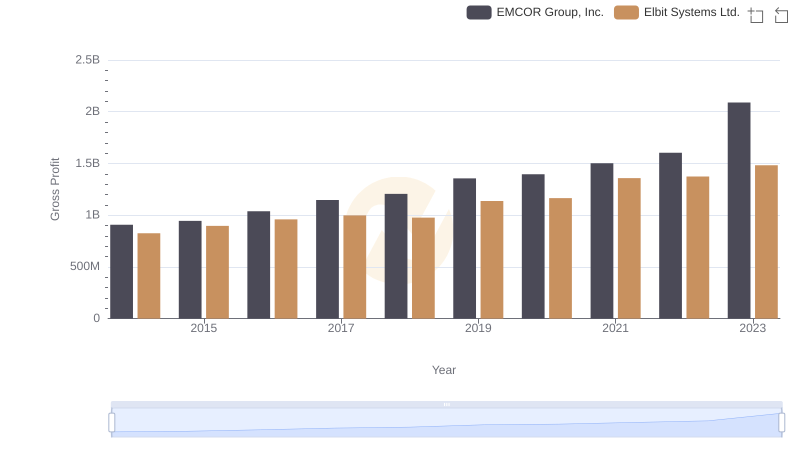
EMCOR Group, Inc. vs Elbit Systems Ltd.: A Gross Profit Performance Breakdown
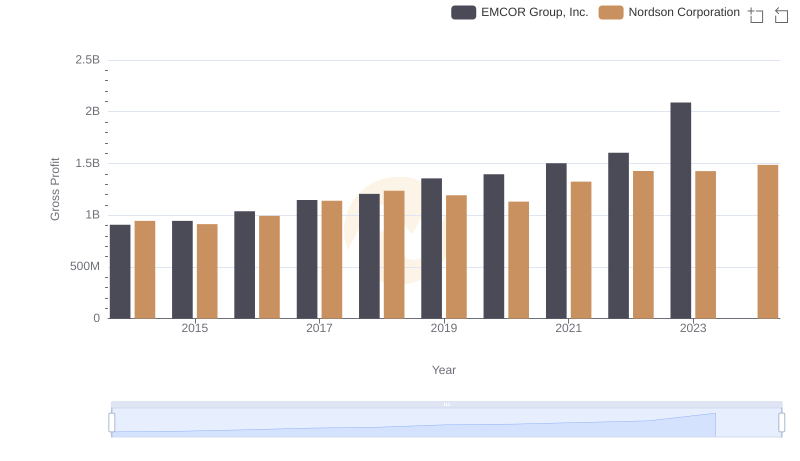
Key Insights on Gross Profit: EMCOR Group, Inc. vs Nordson Corporation
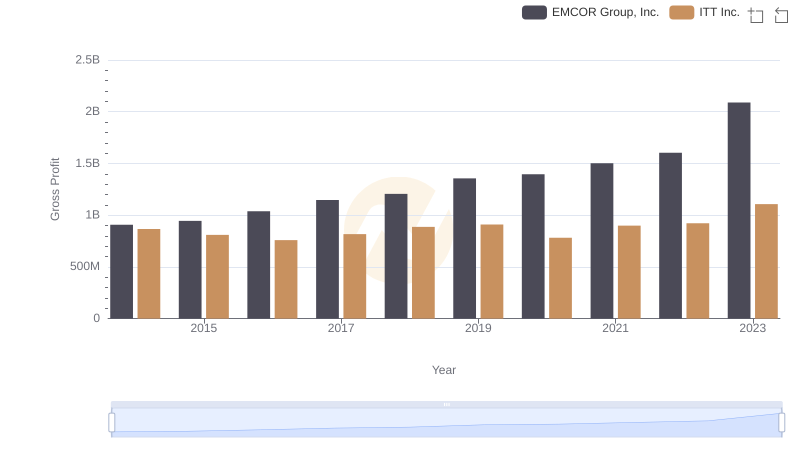
Who Generates Higher Gross Profit? EMCOR Group, Inc. or ITT Inc.
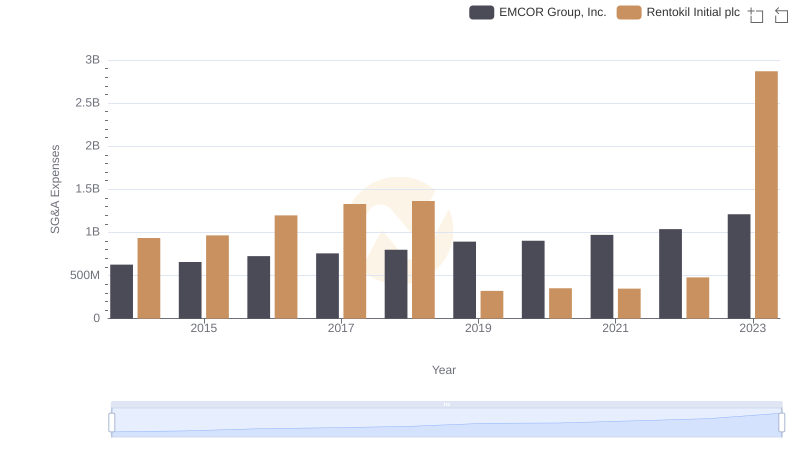
EMCOR Group, Inc. and Rentokil Initial plc: SG&A Spending Patterns Compared
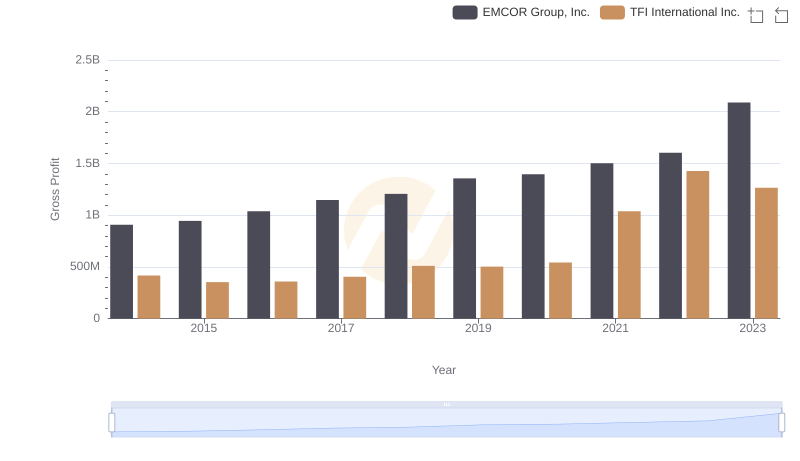
Gross Profit Analysis: Comparing EMCOR Group, Inc. and TFI International Inc.
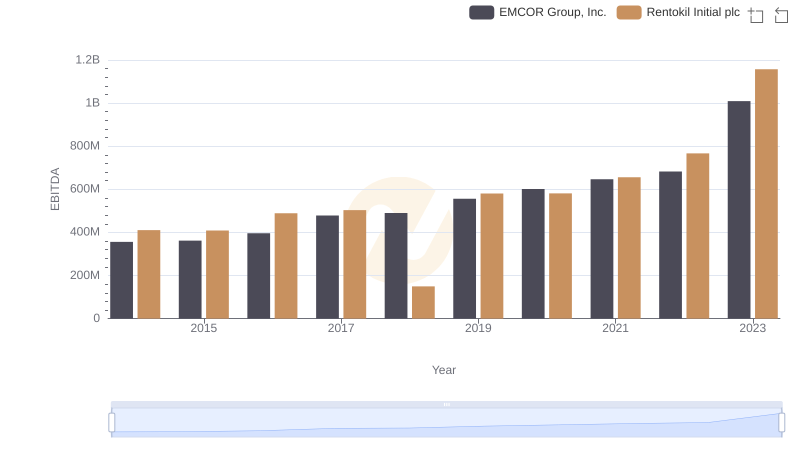
EBITDA Performance Review: EMCOR Group, Inc. vs Rentokil Initial plc