| __timestamp | EMCOR Group, Inc. | Rentokil Initial plc |
|---|---|---|
| Wednesday, January 1, 2014 | 5517719000 | 297500000 |
| Thursday, January 1, 2015 | 5774247000 | 310200000 |
| Friday, January 1, 2016 | 6513662000 | 376100000 |
| Sunday, January 1, 2017 | 6539987000 | 474900000 |
| Monday, January 1, 2018 | 6925178000 | 514200000 |
| Tuesday, January 1, 2019 | 7818743000 | 2099000000 |
| Wednesday, January 1, 2020 | 7401679000 | 2136400000 |
| Friday, January 1, 2021 | 8401843000 | 2239100000 |
| Saturday, January 1, 2022 | 9472526000 | 2737000000 |
| Sunday, January 1, 2023 | 10493534000 | 927000000 |
Cracking the code
In the ever-evolving landscape of global business, understanding cost structures is crucial. Over the past decade, EMCOR Group, Inc. and Rentokil Initial plc have showcased contrasting trajectories in their cost of revenue. EMCOR, a leader in mechanical and electrical construction services, has seen its cost of revenue grow by approximately 90% from 2014 to 2023, reflecting its expanding operations and market reach. In contrast, Rentokil, a prominent player in pest control and hygiene services, experienced a more modest increase of around 210% during the same period, with a notable spike in 2019 and 2020. This divergence highlights the distinct operational strategies and market conditions faced by these industry giants. As businesses navigate the complexities of the modern economy, these insights into cost management offer valuable lessons for stakeholders and investors alike.
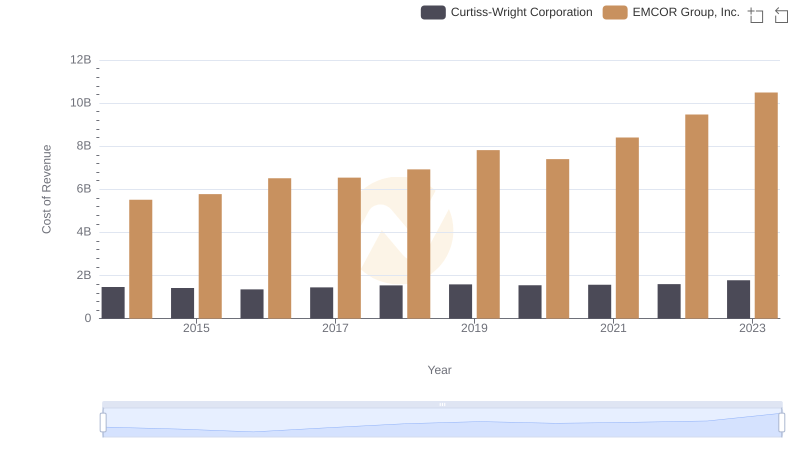
Comparing Cost of Revenue Efficiency: EMCOR Group, Inc. vs Curtiss-Wright Corporation
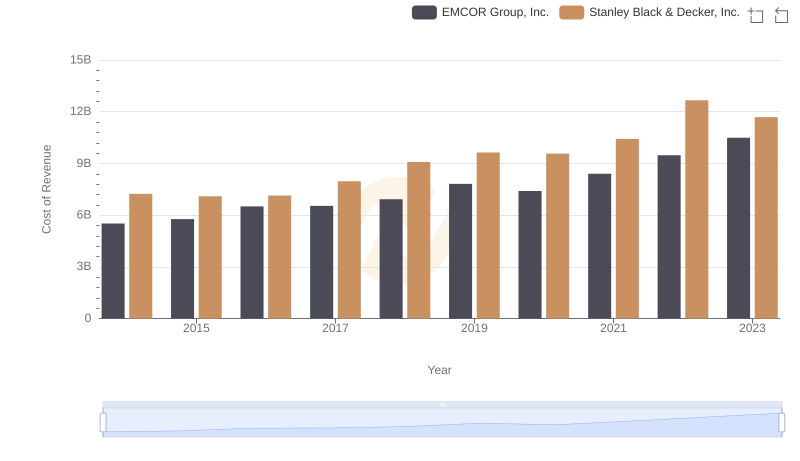
Cost of Revenue: Key Insights for EMCOR Group, Inc. and Stanley Black & Decker, Inc.
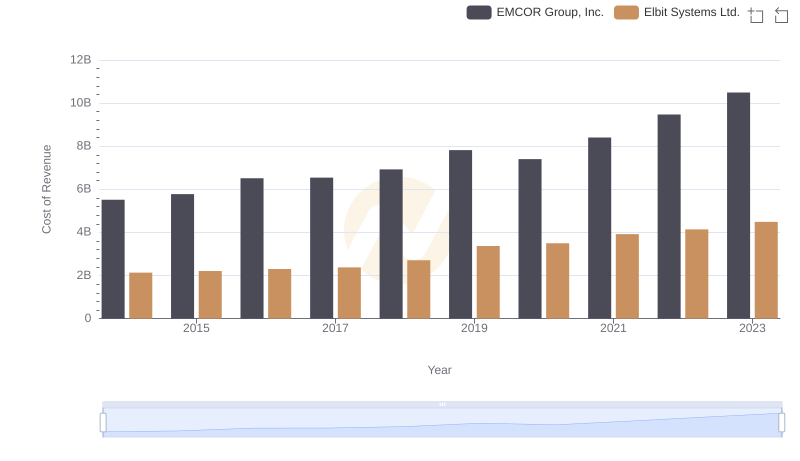
Cost of Revenue Trends: EMCOR Group, Inc. vs Elbit Systems Ltd.
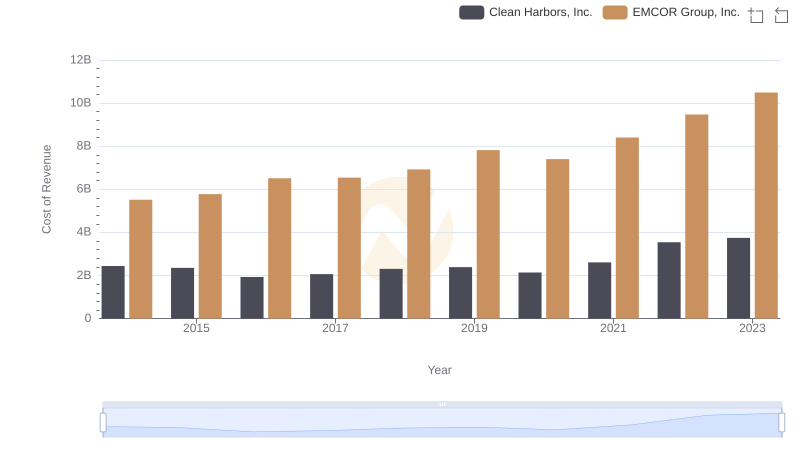
Cost of Revenue Trends: EMCOR Group, Inc. vs Clean Harbors, Inc.
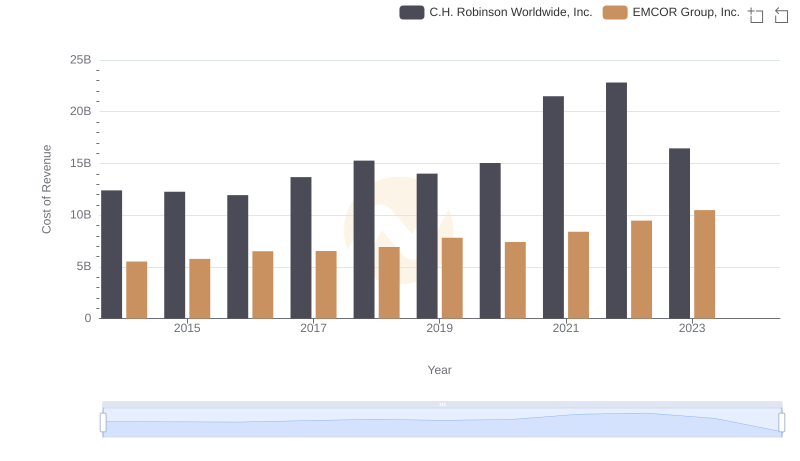
Cost of Revenue Comparison: EMCOR Group, Inc. vs C.H. Robinson Worldwide, Inc.
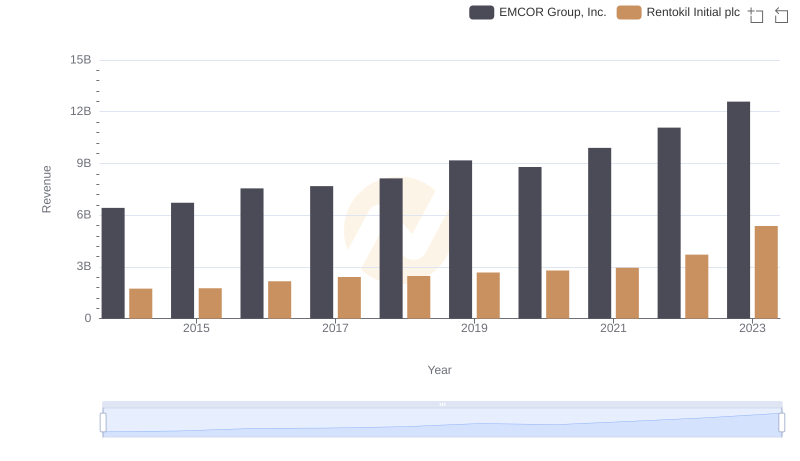
Who Generates More Revenue? EMCOR Group, Inc. or Rentokil Initial plc
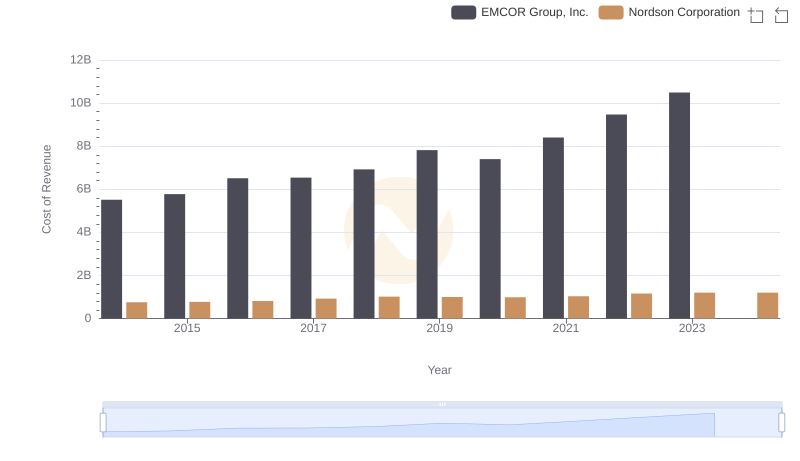
Cost of Revenue: Key Insights for EMCOR Group, Inc. and Nordson Corporation
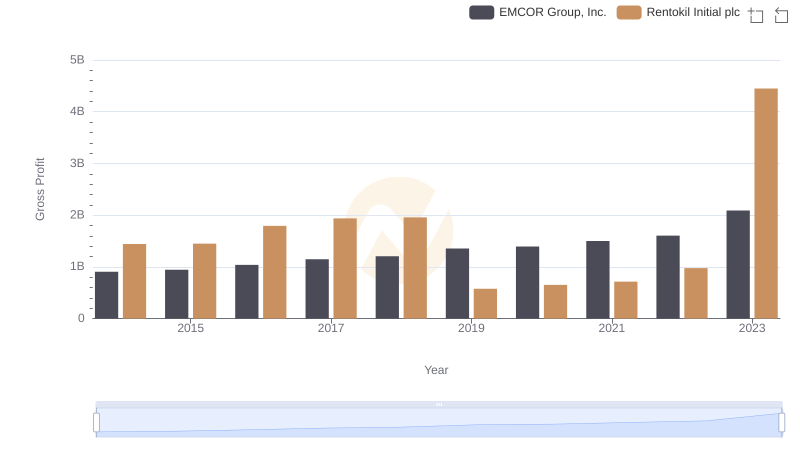
Who Generates Higher Gross Profit? EMCOR Group, Inc. or Rentokil Initial plc
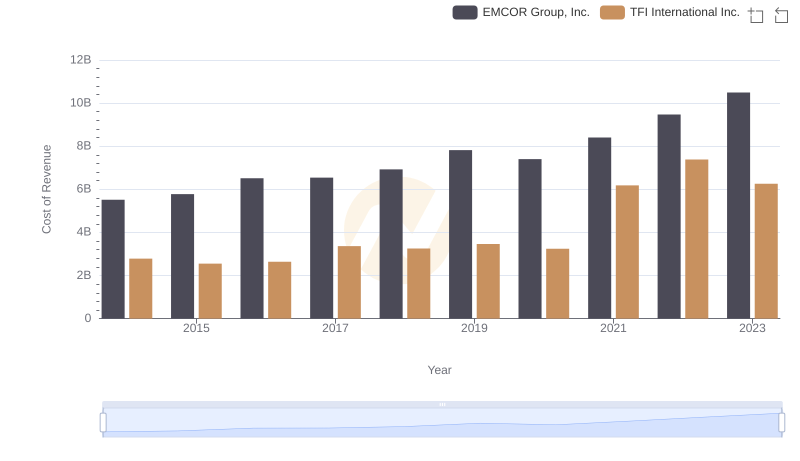
EMCOR Group, Inc. vs TFI International Inc.: Efficiency in Cost of Revenue Explored
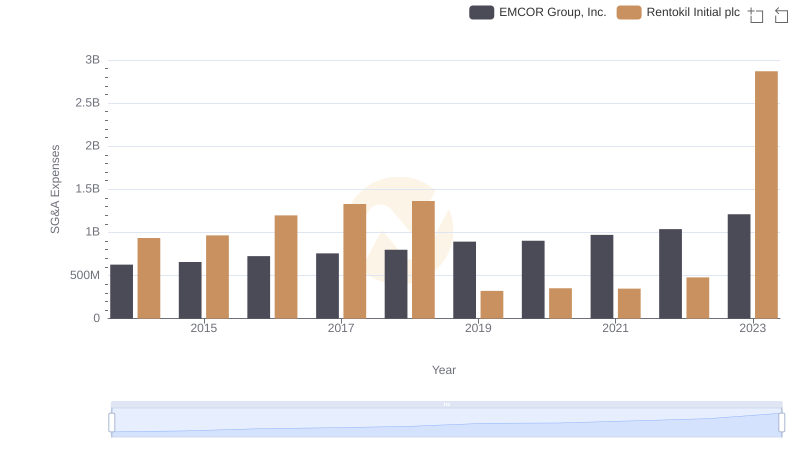
EMCOR Group, Inc. and Rentokil Initial plc: SG&A Spending Patterns Compared
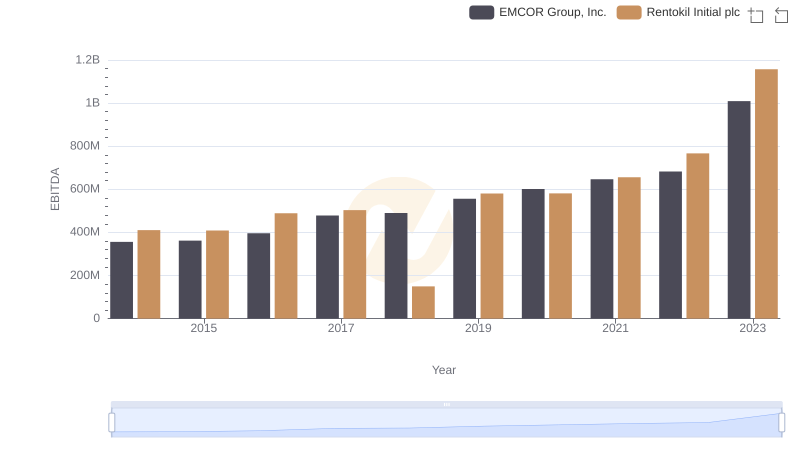
EBITDA Performance Review: EMCOR Group, Inc. vs Rentokil Initial plc