| __timestamp | EMCOR Group, Inc. | Rentokil Initial plc |
|---|---|---|
| Wednesday, January 1, 2014 | 6424965000 | 1740800000 |
| Thursday, January 1, 2015 | 6718726000 | 1759000000 |
| Friday, January 1, 2016 | 7551524000 | 2168100000 |
| Sunday, January 1, 2017 | 7686999000 | 2412300000 |
| Monday, January 1, 2018 | 8130631000 | 2472300000 |
| Tuesday, January 1, 2019 | 9174611000 | 2676200000 |
| Wednesday, January 1, 2020 | 8797061000 | 2789400000 |
| Friday, January 1, 2021 | 9903580000 | 2953900000 |
| Saturday, January 1, 2022 | 11076120000 | 3714000000 |
| Sunday, January 1, 2023 | 12582873000 | 5375000000 |
Infusing magic into the data realm
In the competitive landscape of global business, revenue generation is a key indicator of success. Over the past decade, EMCOR Group, Inc. has consistently outperformed Rentokil Initial plc in terms of revenue. Starting in 2014, EMCOR's revenue was nearly 3.7 times that of Rentokil, and by 2023, this gap widened, with EMCOR generating more than double the revenue of Rentokil. This growth trajectory highlights EMCOR's robust business strategies and market presence.
From 2014 to 2023, EMCOR's revenue surged by approximately 96%, while Rentokil's revenue increased by about 209%. Despite Rentokil's impressive growth rate, EMCOR's larger revenue base has kept it ahead in absolute terms. This data underscores the dynamic nature of the industry and the importance of strategic planning in maintaining a competitive edge.
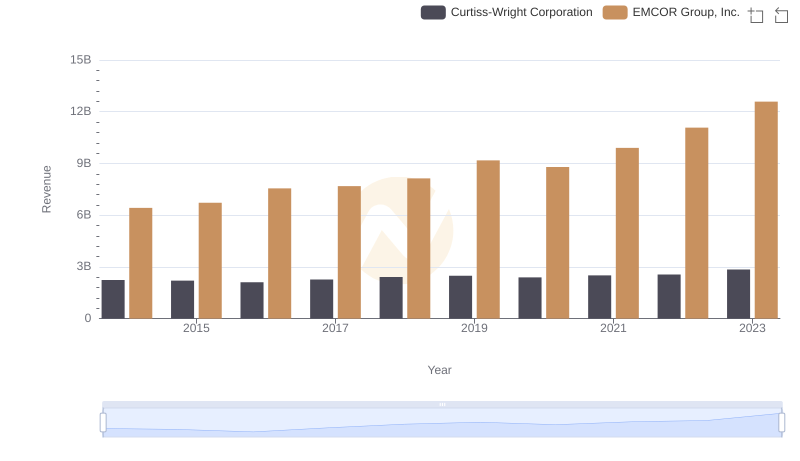
Comparing Revenue Performance: EMCOR Group, Inc. or Curtiss-Wright Corporation?
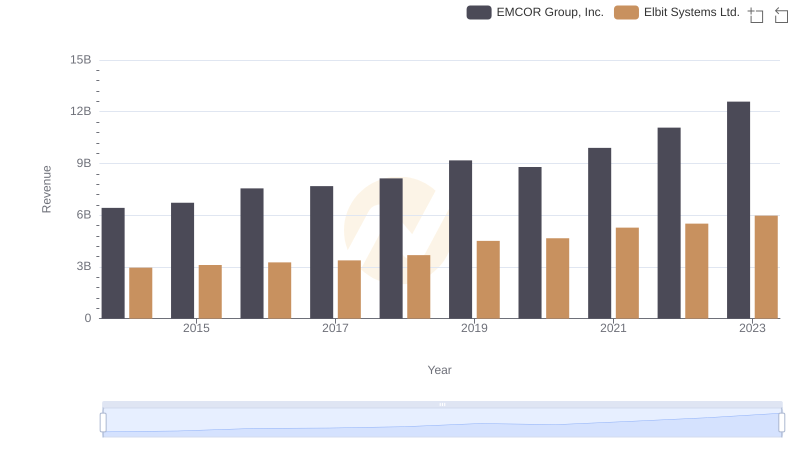
Comparing Revenue Performance: EMCOR Group, Inc. or Elbit Systems Ltd.?
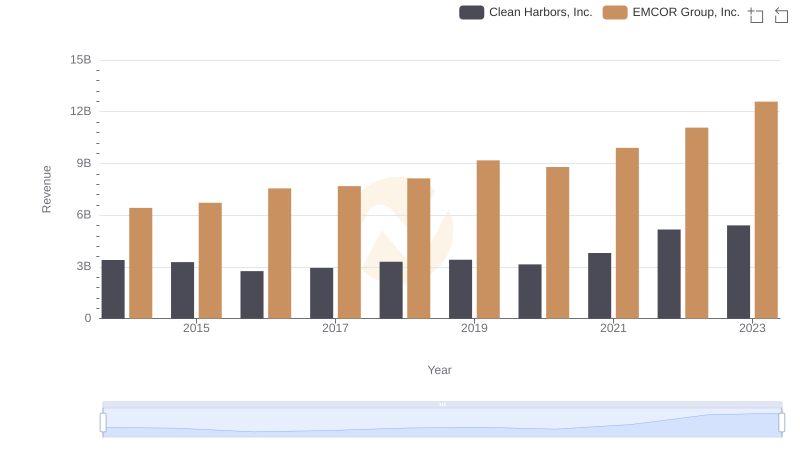
Breaking Down Revenue Trends: EMCOR Group, Inc. vs Clean Harbors, Inc.
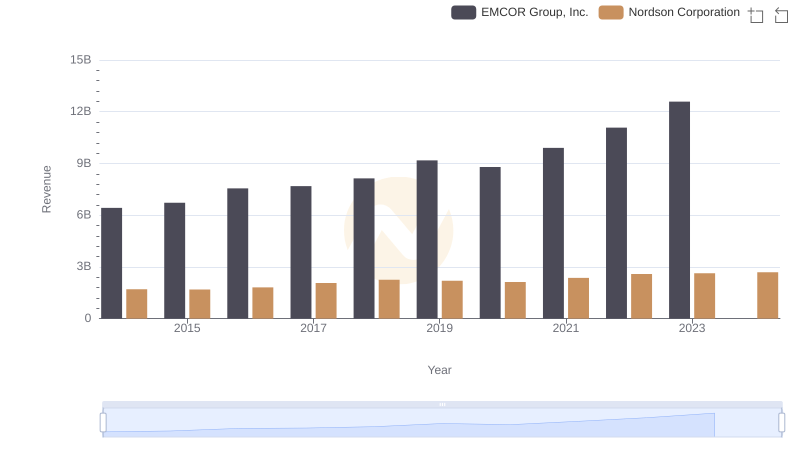
Who Generates More Revenue? EMCOR Group, Inc. or Nordson Corporation
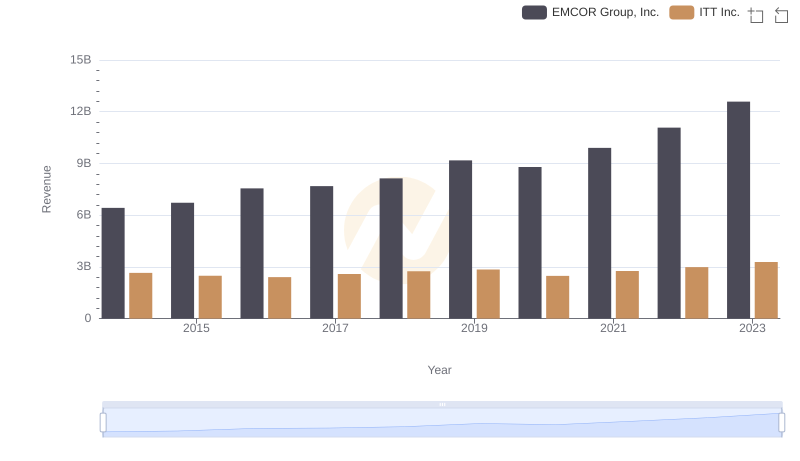
EMCOR Group, Inc. vs ITT Inc.: Annual Revenue Growth Compared
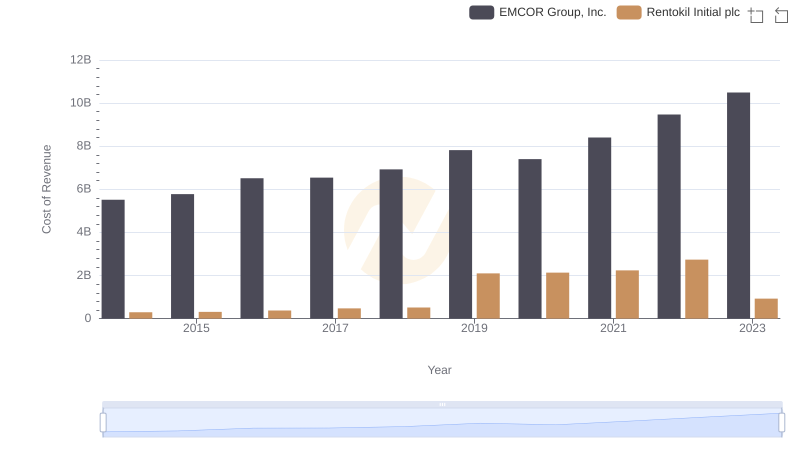
Analyzing Cost of Revenue: EMCOR Group, Inc. and Rentokil Initial plc
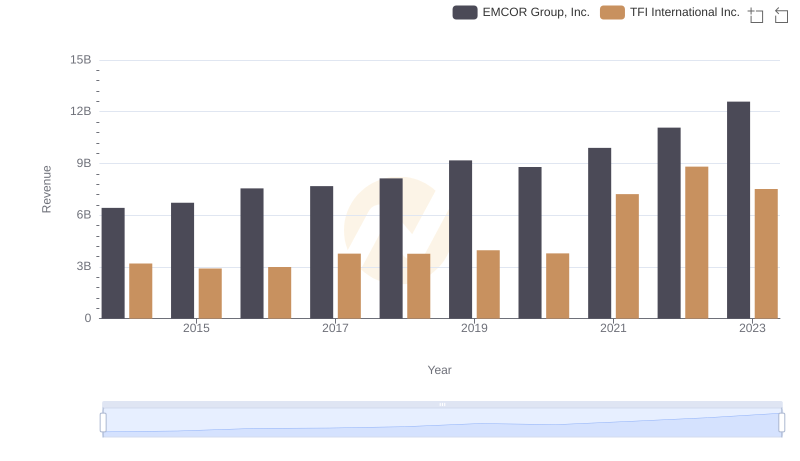
Comparing Revenue Performance: EMCOR Group, Inc. or TFI International Inc.?
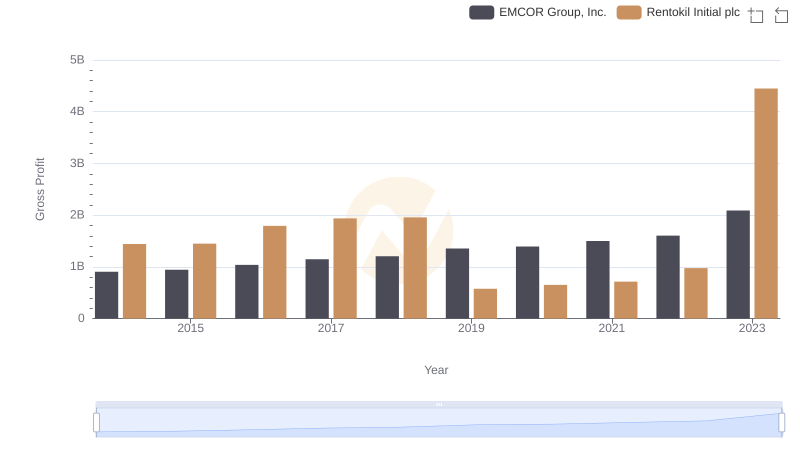
Who Generates Higher Gross Profit? EMCOR Group, Inc. or Rentokil Initial plc
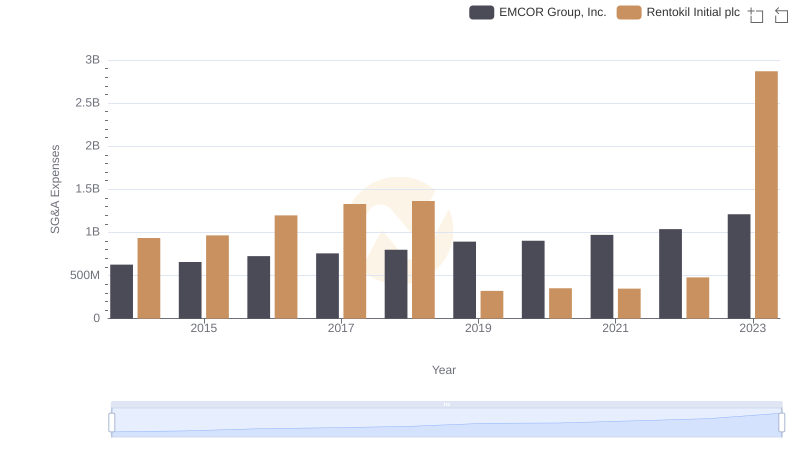
EMCOR Group, Inc. and Rentokil Initial plc: SG&A Spending Patterns Compared
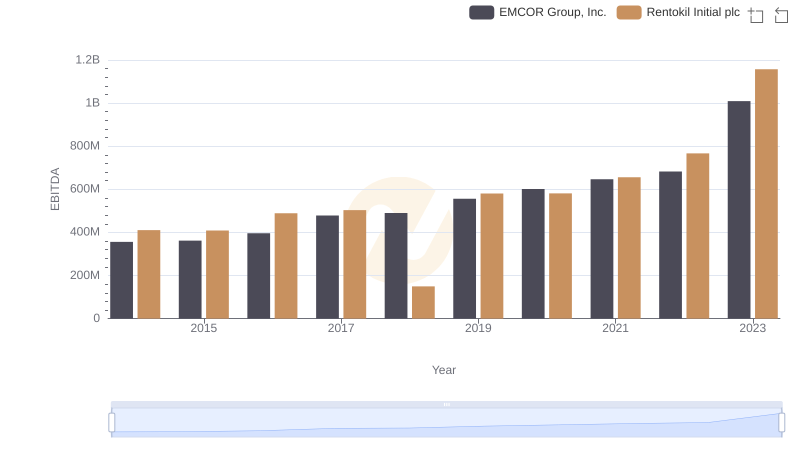
EBITDA Performance Review: EMCOR Group, Inc. vs Rentokil Initial plc