| __timestamp | EMCOR Group, Inc. | Rentokil Initial plc |
|---|---|---|
| Wednesday, January 1, 2014 | 626478000 | 935700000 |
| Thursday, January 1, 2015 | 656573000 | 965700000 |
| Friday, January 1, 2016 | 725538000 | 1197600000 |
| Sunday, January 1, 2017 | 757062000 | 1329600000 |
| Monday, January 1, 2018 | 799157000 | 1364000000 |
| Tuesday, January 1, 2019 | 893453000 | 322500000 |
| Wednesday, January 1, 2020 | 903584000 | 352000000 |
| Friday, January 1, 2021 | 970937000 | 348600000 |
| Saturday, January 1, 2022 | 1038717000 | 479000000 |
| Sunday, January 1, 2023 | 1211233000 | 2870000000 |
Unveiling the hidden dimensions of data
In the ever-evolving landscape of corporate finance, understanding the spending patterns of industry giants can offer valuable insights. Over the past decade, EMCOR Group, Inc. and Rentokil Initial plc have showcased distinct trends in their Selling, General, and Administrative (SG&A) expenses. From 2014 to 2023, EMCOR's SG&A expenses grew by approximately 93%, peaking in 2023. In contrast, Rentokil's expenses fluctuated, with a notable surge of over 800% from 2021 to 2023. This dramatic increase highlights Rentokil's strategic investments or potential restructuring efforts. While EMCOR's steady growth reflects consistent operational scaling, Rentokil's variable pattern suggests a more dynamic approach. These trends underscore the diverse strategies companies employ to navigate market challenges and opportunities. As businesses continue to adapt, monitoring such financial metrics remains crucial for stakeholders aiming to make informed decisions.
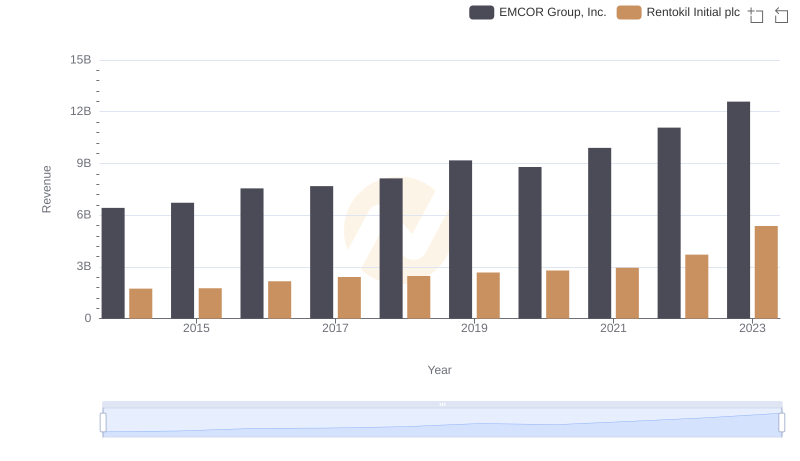
Who Generates More Revenue? EMCOR Group, Inc. or Rentokil Initial plc
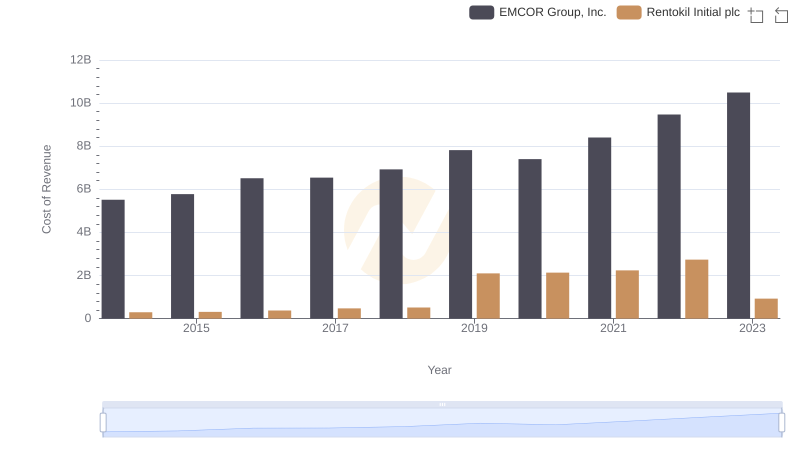
Analyzing Cost of Revenue: EMCOR Group, Inc. and Rentokil Initial plc
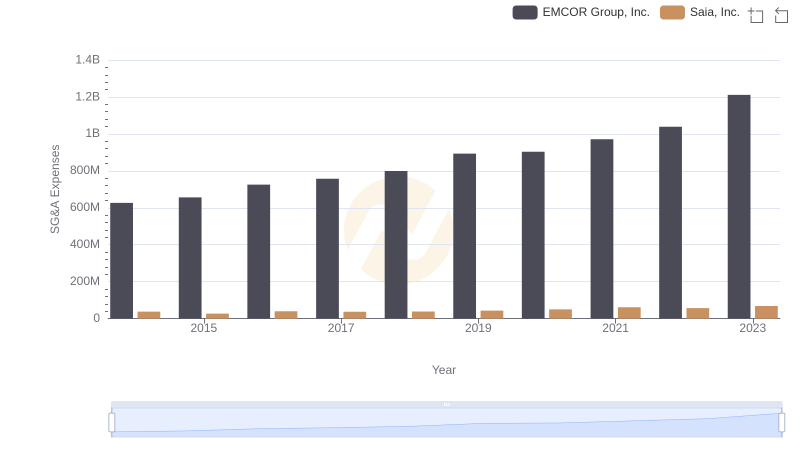
SG&A Efficiency Analysis: Comparing EMCOR Group, Inc. and Saia, Inc.
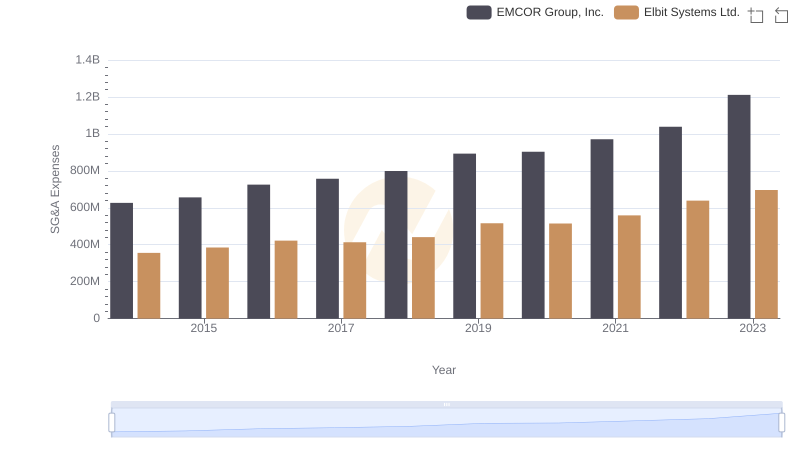
Breaking Down SG&A Expenses: EMCOR Group, Inc. vs Elbit Systems Ltd.
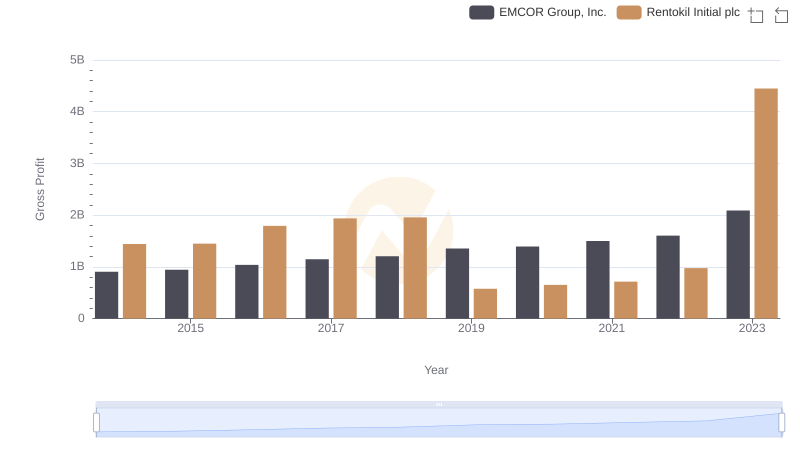
Who Generates Higher Gross Profit? EMCOR Group, Inc. or Rentokil Initial plc
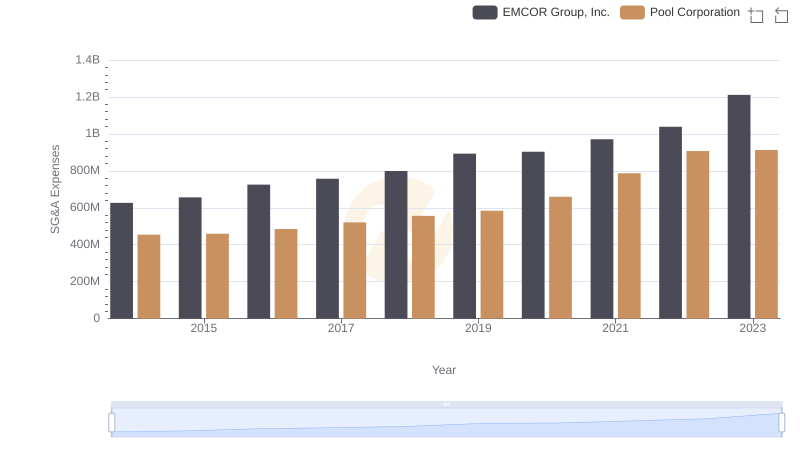
EMCOR Group, Inc. vs Pool Corporation: SG&A Expense Trends
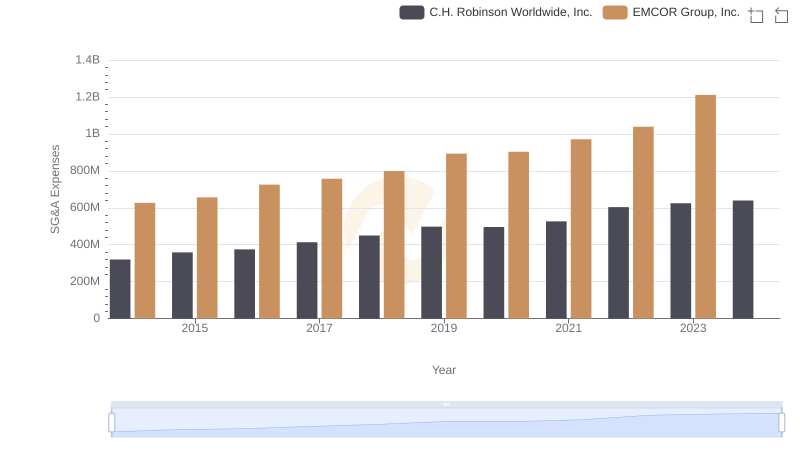
EMCOR Group, Inc. or C.H. Robinson Worldwide, Inc.: Who Manages SG&A Costs Better?
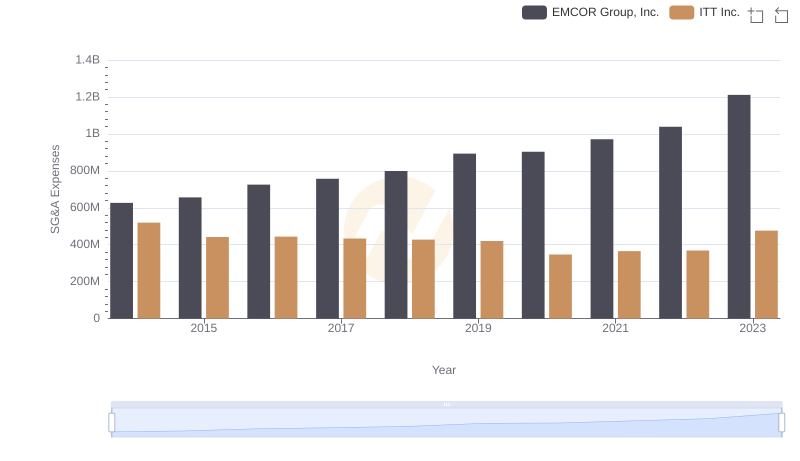
EMCOR Group, Inc. vs ITT Inc.: SG&A Expense Trends
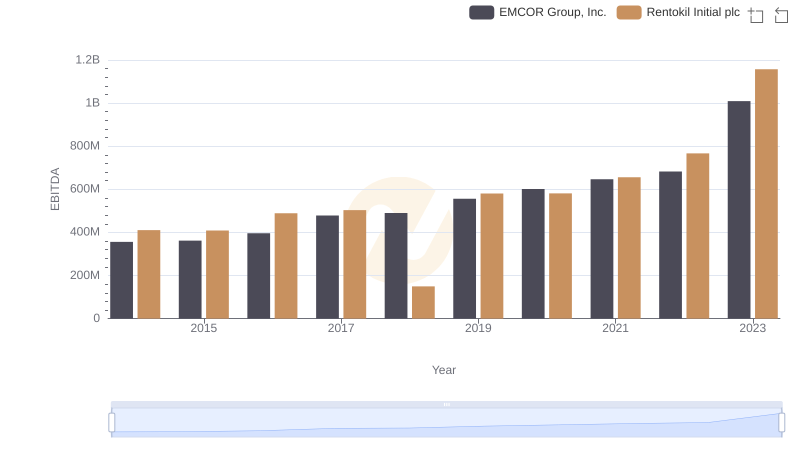
EBITDA Performance Review: EMCOR Group, Inc. vs Rentokil Initial plc