| __timestamp | Cintas Corporation | Hubbell Incorporated |
|---|---|---|
| Wednesday, January 1, 2014 | 793811000 | 594700000 |
| Thursday, January 1, 2015 | 877761000 | 533600000 |
| Friday, January 1, 2016 | 933728000 | 564700000 |
| Sunday, January 1, 2017 | 968293000 | 585600000 |
| Monday, January 1, 2018 | 1227852000 | 677500000 |
| Tuesday, January 1, 2019 | 1564228000 | 740900000 |
| Wednesday, January 1, 2020 | 1542737000 | 671400000 |
| Friday, January 1, 2021 | 1773591000 | 661000000 |
| Saturday, January 1, 2022 | 1990046000 | 854300000 |
| Sunday, January 1, 2023 | 2221676000 | 1169700000 |
| Monday, January 1, 2024 | 2523857000 | 1291200000 |
Data in motion
In the competitive landscape of corporate America, Cintas Corporation and Hubbell Incorporated have showcased intriguing EBITDA trends over the past decade. From 2014 to 2023, Cintas Corporation has seen a remarkable growth trajectory, with its EBITDA increasing by over 200%, from approximately $794 million to $2.22 billion. This growth reflects Cintas's strategic expansions and operational efficiencies.
In contrast, Hubbell Incorporated, while also experiencing growth, has shown a more modest increase of around 97% in EBITDA, rising from $595 million in 2014 to $1.17 billion in 2023. This difference highlights the varying strategies and market conditions faced by these two industry leaders.
Interestingly, the data for 2024 is incomplete for Hubbell, suggesting potential challenges or reporting delays. As these companies continue to evolve, their financial metrics offer valuable insights into their operational health and strategic directions.
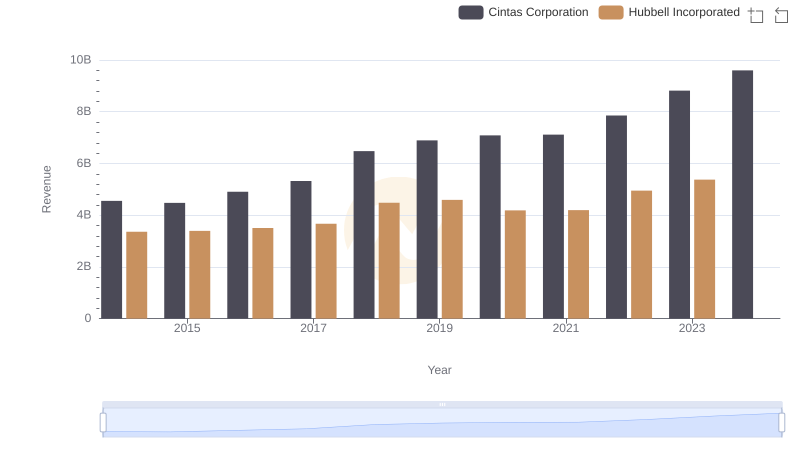
Comparing Revenue Performance: Cintas Corporation or Hubbell Incorporated?
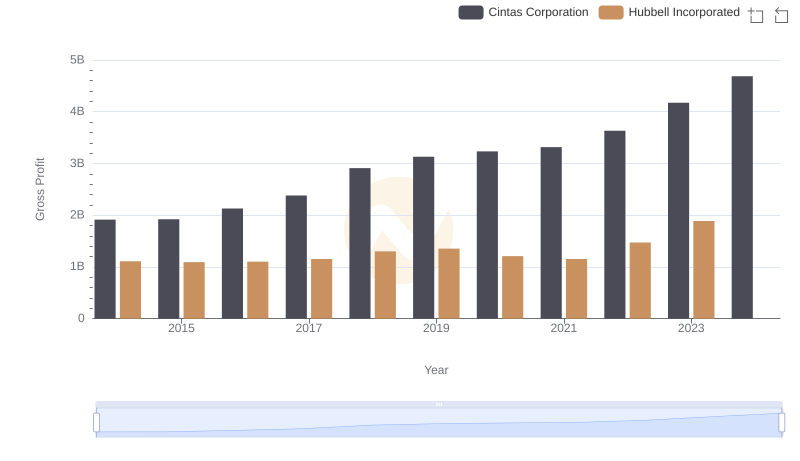
Gross Profit Comparison: Cintas Corporation and Hubbell Incorporated Trends
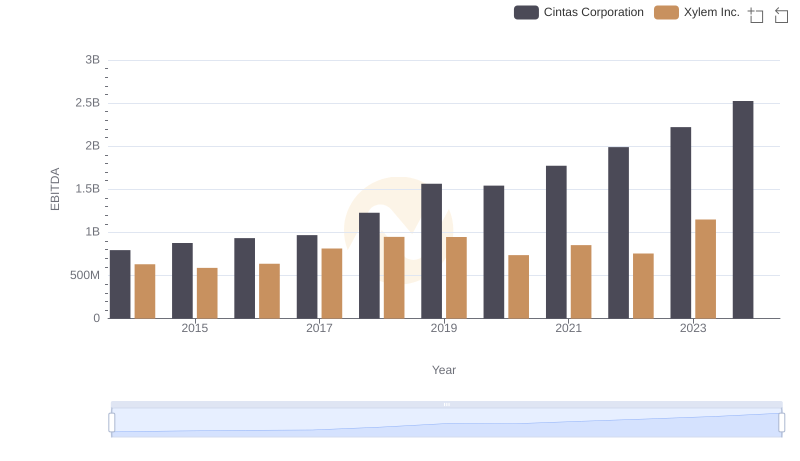
Professional EBITDA Benchmarking: Cintas Corporation vs Xylem Inc.
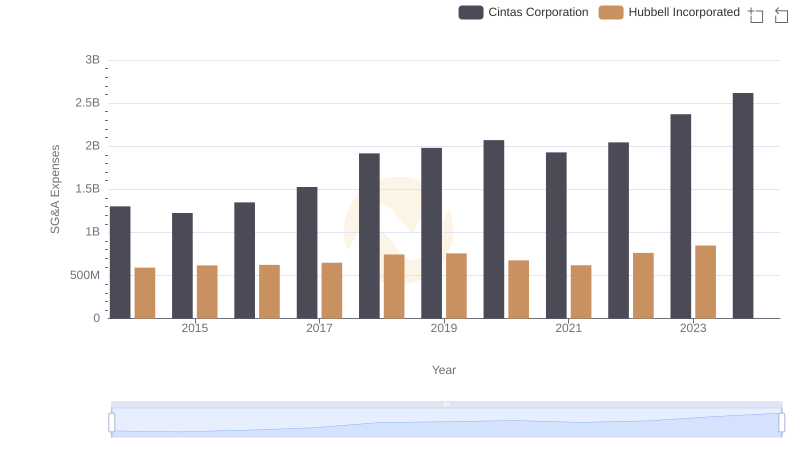
SG&A Efficiency Analysis: Comparing Cintas Corporation and Hubbell Incorporated
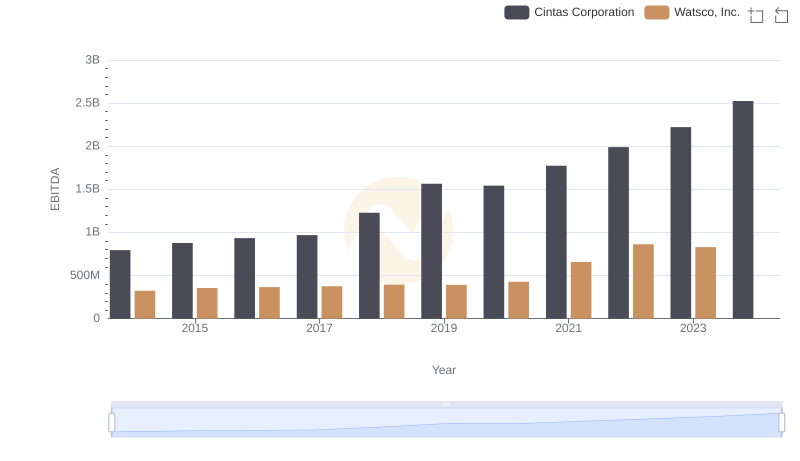
Cintas Corporation and Watsco, Inc.: A Detailed Examination of EBITDA Performance
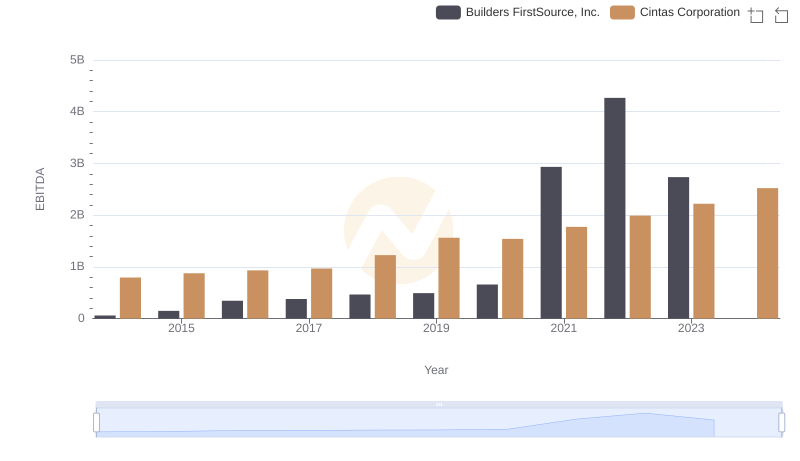
A Side-by-Side Analysis of EBITDA: Cintas Corporation and Builders FirstSource, Inc.
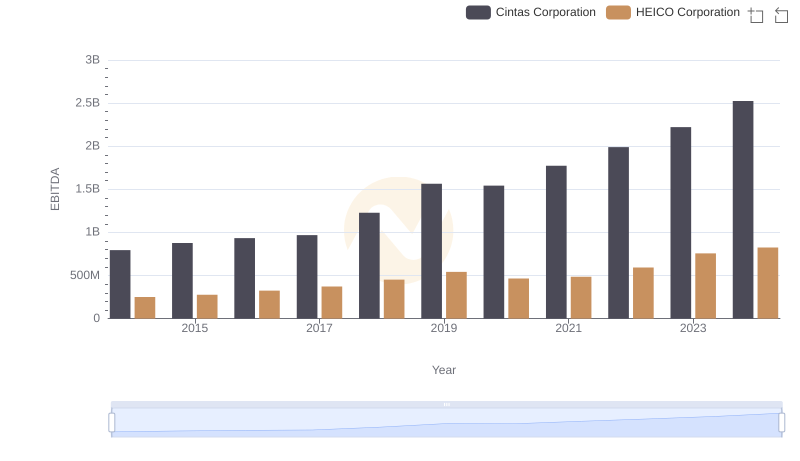
A Professional Review of EBITDA: Cintas Corporation Compared to HEICO Corporation
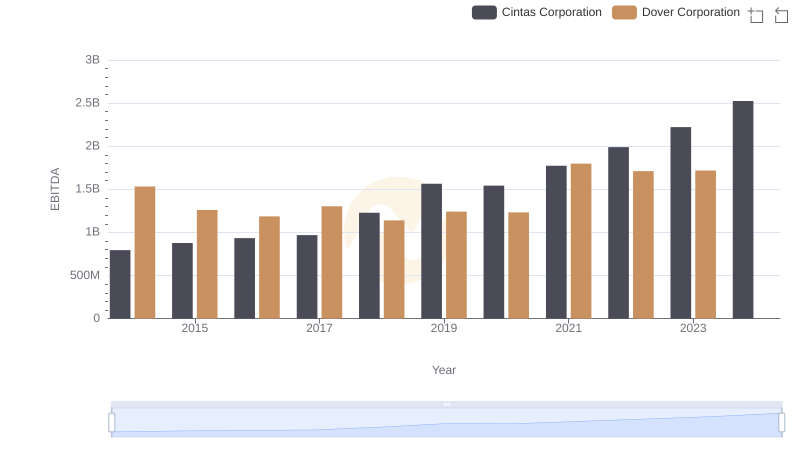
EBITDA Performance Review: Cintas Corporation vs Dover Corporation
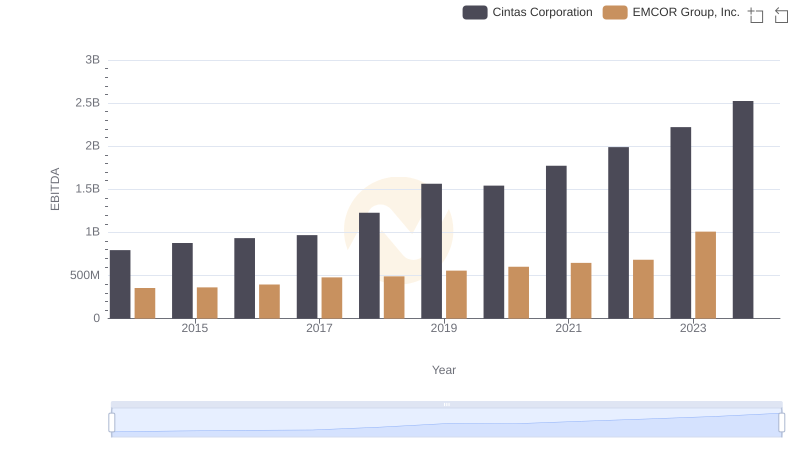
EBITDA Analysis: Evaluating Cintas Corporation Against EMCOR Group, Inc.
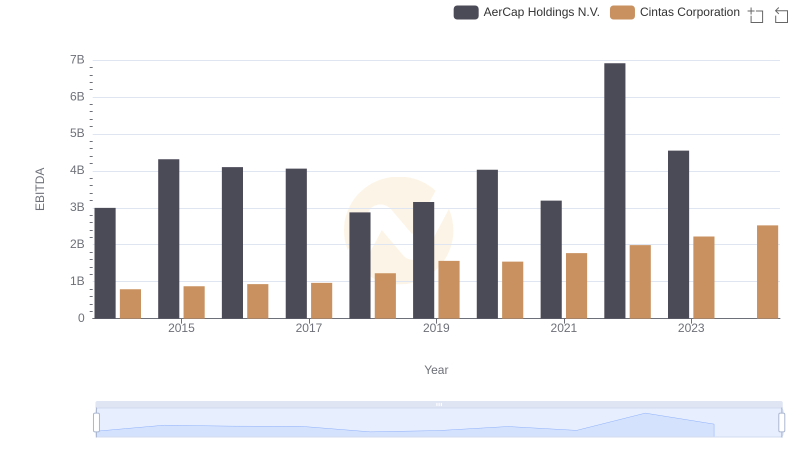
EBITDA Performance Review: Cintas Corporation vs AerCap Holdings N.V.