| __timestamp | Cintas Corporation | HEICO Corporation |
|---|---|---|
| Wednesday, January 1, 2014 | 793811000 | 251213000 |
| Thursday, January 1, 2015 | 877761000 | 276790000 |
| Friday, January 1, 2016 | 933728000 | 325022000 |
| Sunday, January 1, 2017 | 968293000 | 372581000 |
| Monday, January 1, 2018 | 1227852000 | 452287000 |
| Tuesday, January 1, 2019 | 1564228000 | 542136000 |
| Wednesday, January 1, 2020 | 1542737000 | 465714000 |
| Friday, January 1, 2021 | 1773591000 | 486243000 |
| Saturday, January 1, 2022 | 1990046000 | 592709000 |
| Sunday, January 1, 2023 | 2221676000 | 756767000 |
| Monday, January 1, 2024 | 2523857000 | 824455000 |
Unveiling the hidden dimensions of data
In the competitive landscape of corporate America, Cintas Corporation and HEICO Corporation have demonstrated remarkable EBITDA growth over the past decade. Since 2014, Cintas has seen its EBITDA soar by over 200%, reaching a peak in 2024. This growth reflects Cintas's strategic expansion and operational efficiency. Meanwhile, HEICO, a leader in aerospace and electronics, has also shown impressive growth, with its EBITDA increasing by more than 225% during the same period.
This analysis underscores the importance of strategic management and innovation in driving financial success.
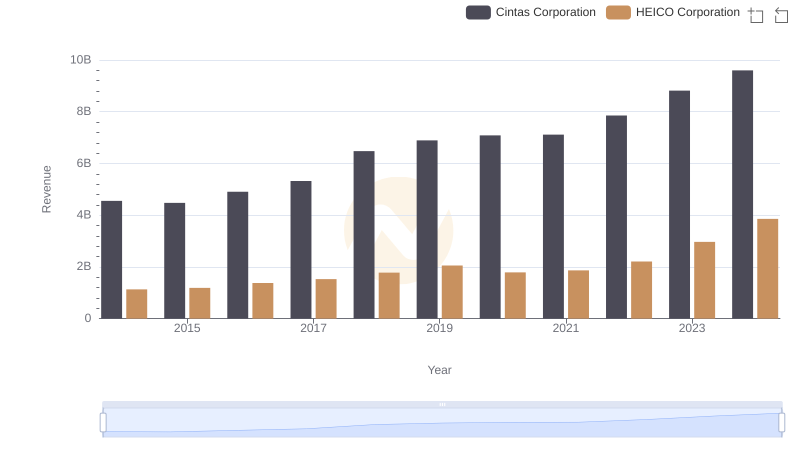
Breaking Down Revenue Trends: Cintas Corporation vs HEICO Corporation
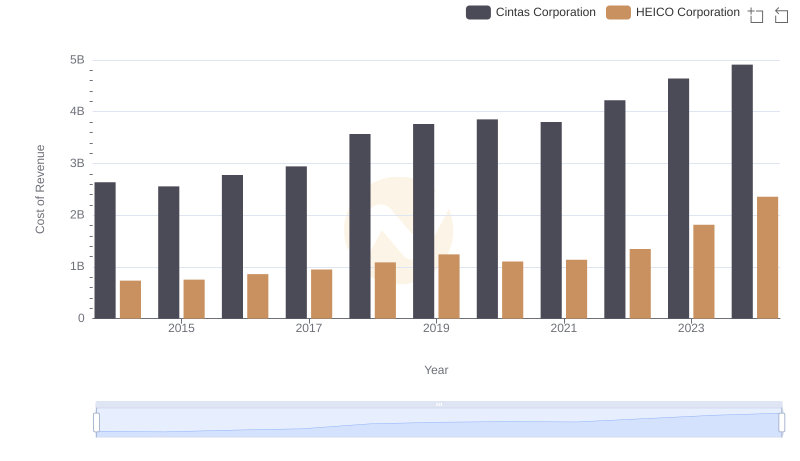
Cintas Corporation vs HEICO Corporation: Efficiency in Cost of Revenue Explored
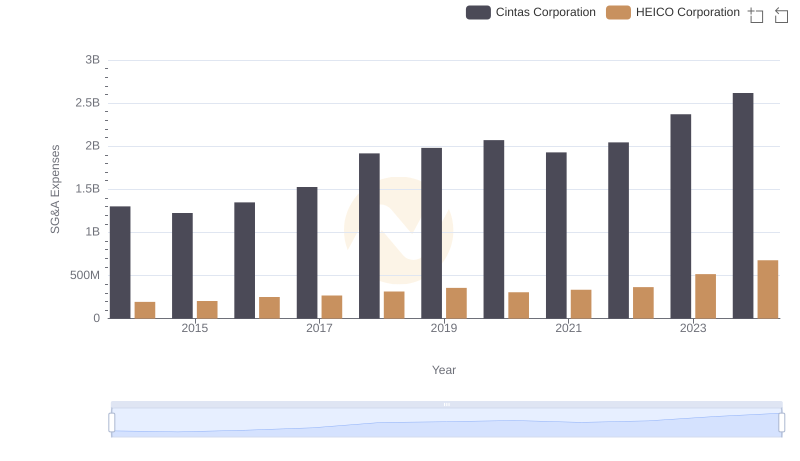
Cintas Corporation vs HEICO Corporation: SG&A Expense Trends
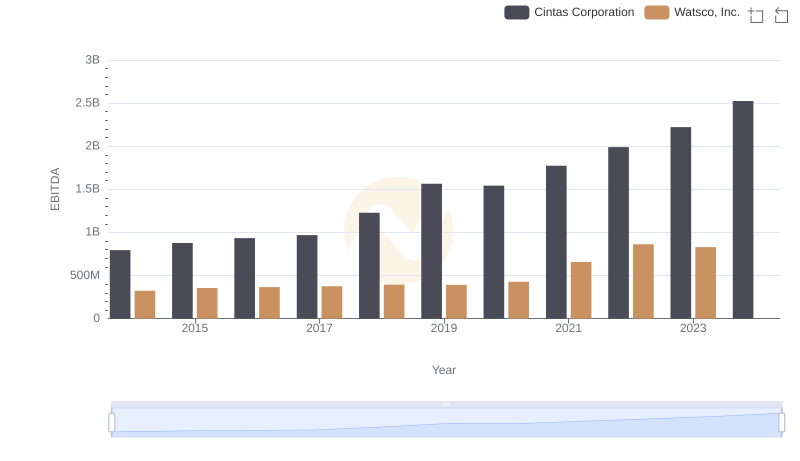
Cintas Corporation and Watsco, Inc.: A Detailed Examination of EBITDA Performance
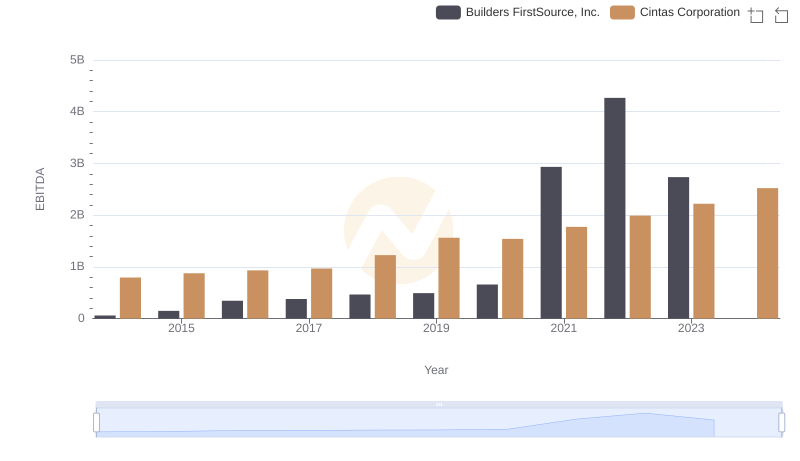
A Side-by-Side Analysis of EBITDA: Cintas Corporation and Builders FirstSource, Inc.
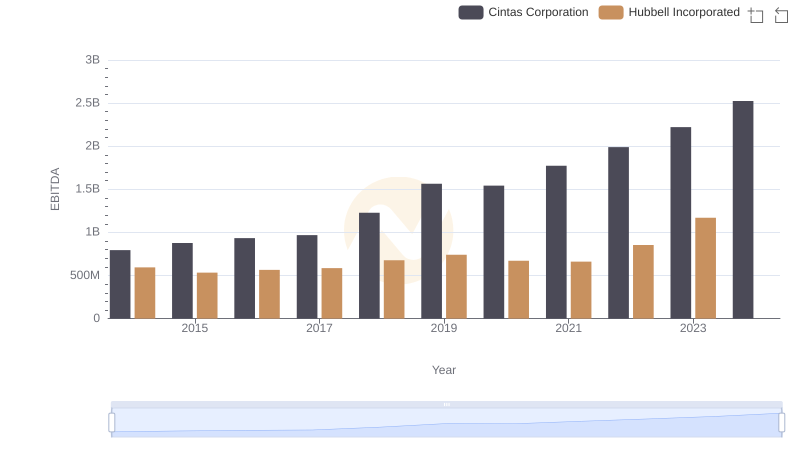
EBITDA Metrics Evaluated: Cintas Corporation vs Hubbell Incorporated
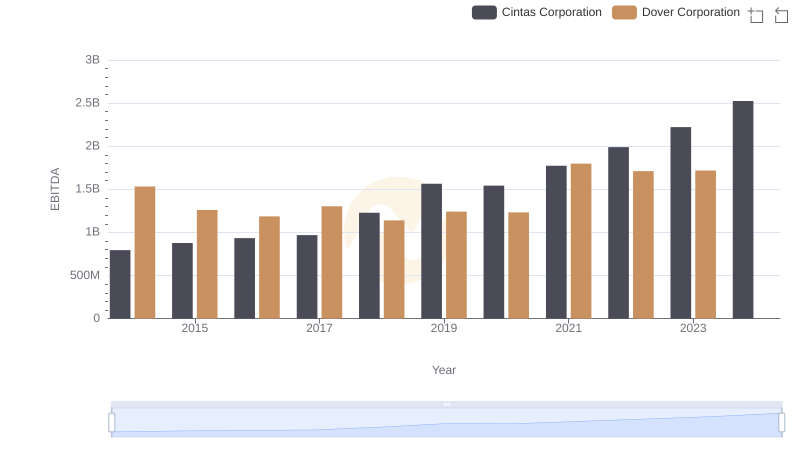
EBITDA Performance Review: Cintas Corporation vs Dover Corporation
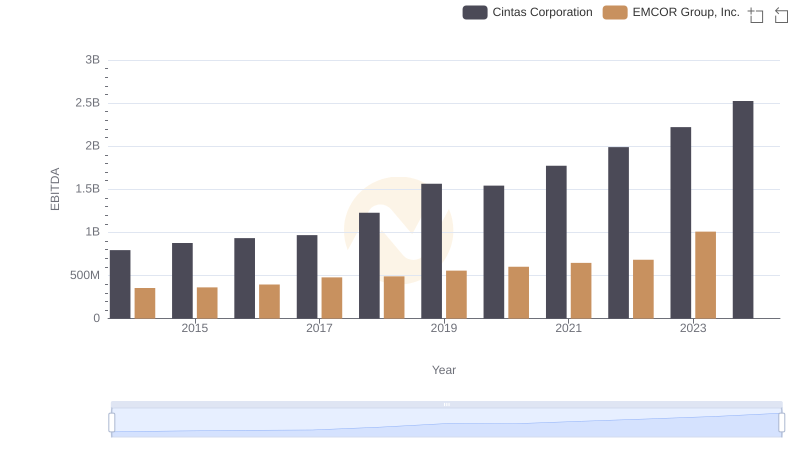
EBITDA Analysis: Evaluating Cintas Corporation Against EMCOR Group, Inc.
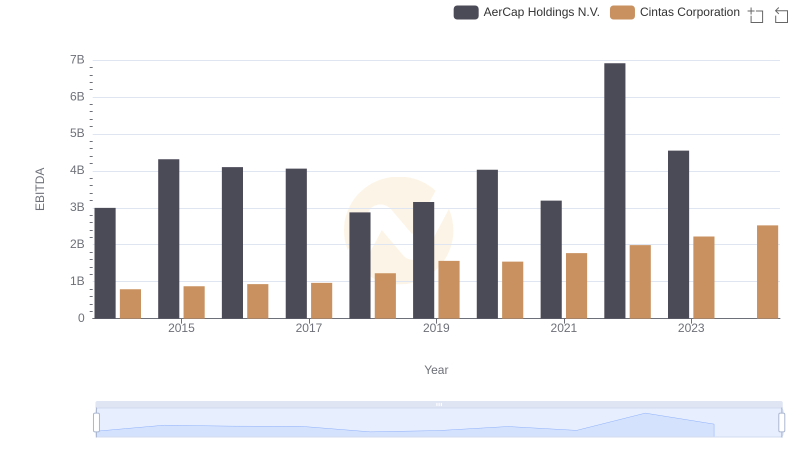
EBITDA Performance Review: Cintas Corporation vs AerCap Holdings N.V.
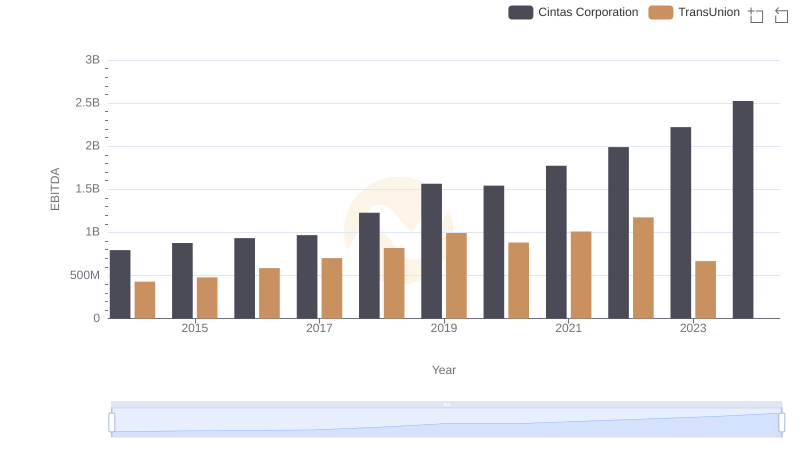
EBITDA Performance Review: Cintas Corporation vs TransUnion