| __timestamp | AerCap Holdings N.V. | Cintas Corporation |
|---|---|---|
| Wednesday, January 1, 2014 | 2997442000 | 793811000 |
| Thursday, January 1, 2015 | 4313510000 | 877761000 |
| Friday, January 1, 2016 | 4101801000 | 933728000 |
| Sunday, January 1, 2017 | 4061381000 | 968293000 |
| Monday, January 1, 2018 | 2874193000 | 1227852000 |
| Tuesday, January 1, 2019 | 3157061000 | 1564228000 |
| Wednesday, January 1, 2020 | 4028661000 | 1542737000 |
| Friday, January 1, 2021 | 3192341000 | 1773591000 |
| Saturday, January 1, 2022 | 6911148000 | 1990046000 |
| Sunday, January 1, 2023 | 4547656000 | 2221676000 |
| Monday, January 1, 2024 | 2523857000 |
Unlocking the unknown
In the competitive landscape of global business, Cintas Corporation and AerCap Holdings N.V. stand as titans in their respective industries. Over the past decade, from 2014 to 2023, these companies have showcased remarkable EBITDA growth, reflecting their operational efficiency and market strategies.
AerCap Holdings N.V., a leader in aircraft leasing, experienced a significant surge in EBITDA, peaking in 2022 with a 70% increase compared to 2014. This growth underscores AerCap's strategic acquisitions and robust demand in the aviation sector. However, 2023 saw a slight dip, indicating potential market adjustments.
Conversely, Cintas Corporation, a key player in corporate uniforms and facility services, demonstrated consistent growth, with EBITDA nearly tripling from 2014 to 2023. This steady rise highlights Cintas's resilience and adaptability in a fluctuating market.
As we look to 2024, Cintas continues its upward trajectory, while AerCap's data remains to be seen, leaving room for speculation and anticipation.
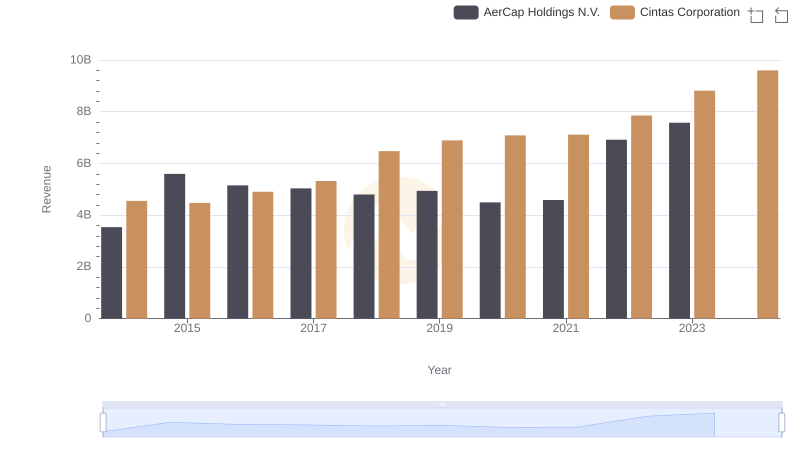
Annual Revenue Comparison: Cintas Corporation vs AerCap Holdings N.V.
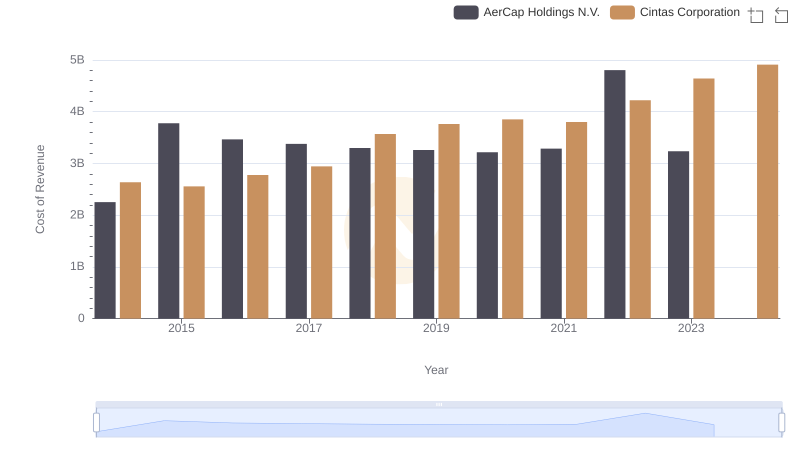
Cost of Revenue Trends: Cintas Corporation vs AerCap Holdings N.V.

Who Generates Higher Gross Profit? Cintas Corporation or AerCap Holdings N.V.
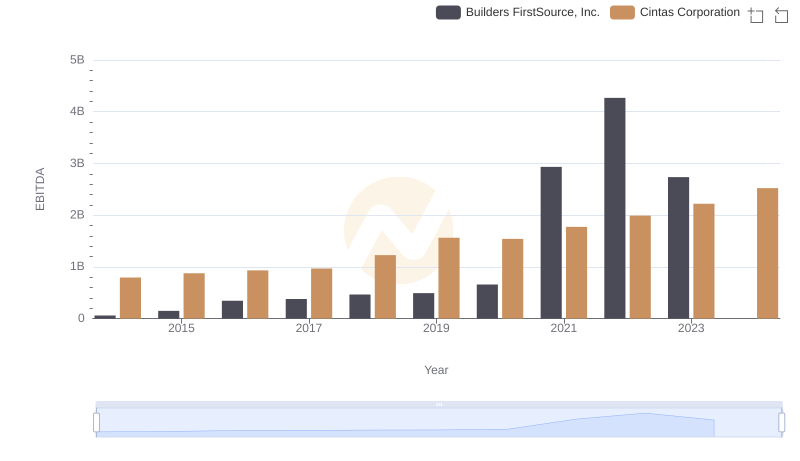
A Side-by-Side Analysis of EBITDA: Cintas Corporation and Builders FirstSource, Inc.
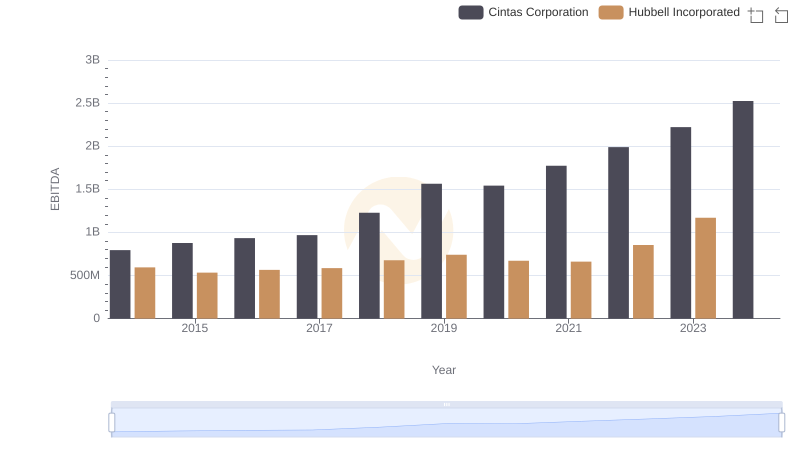
EBITDA Metrics Evaluated: Cintas Corporation vs Hubbell Incorporated
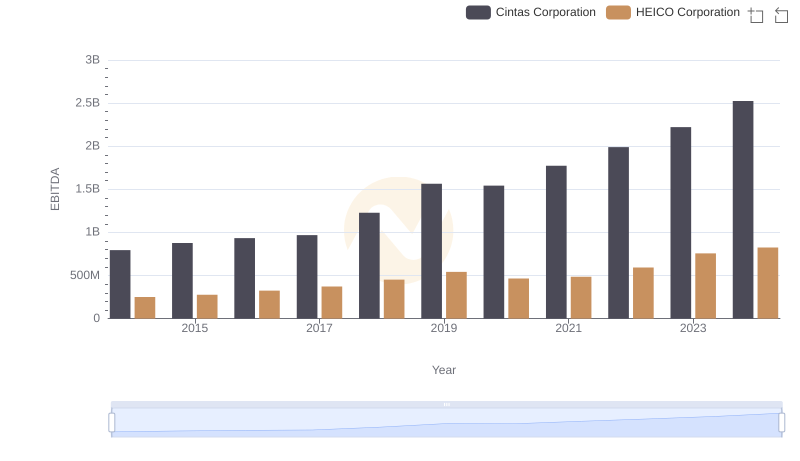
A Professional Review of EBITDA: Cintas Corporation Compared to HEICO Corporation
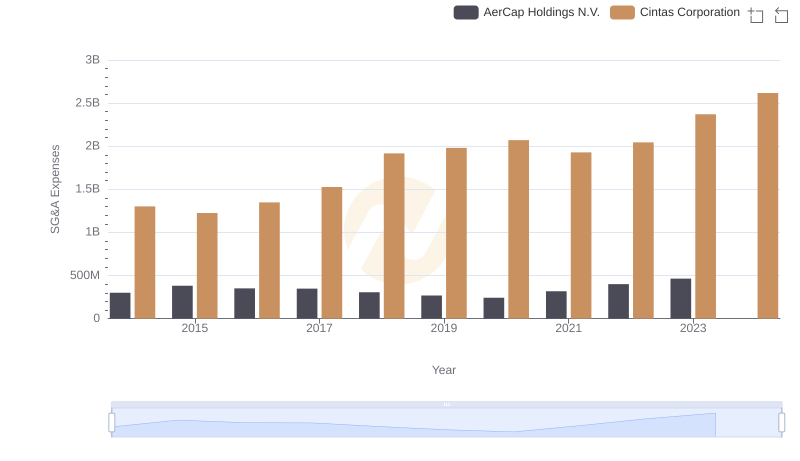
Selling, General, and Administrative Costs: Cintas Corporation vs AerCap Holdings N.V.
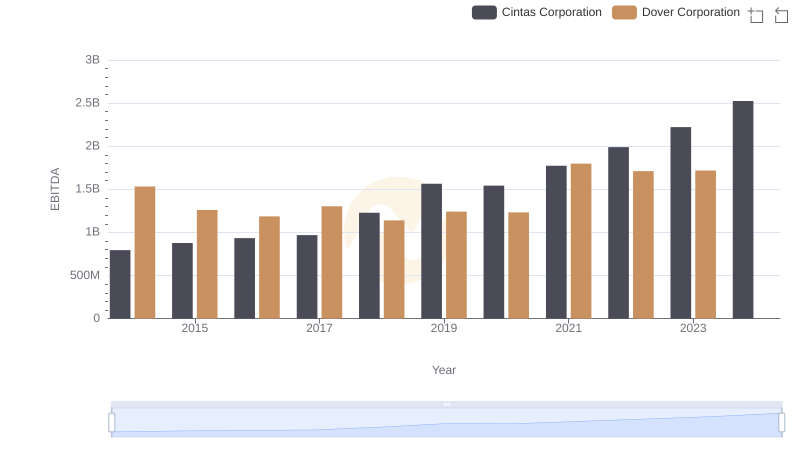
EBITDA Performance Review: Cintas Corporation vs Dover Corporation
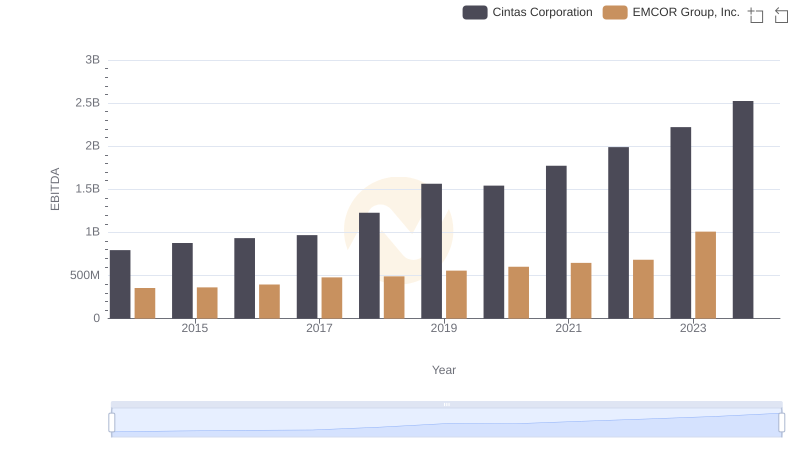
EBITDA Analysis: Evaluating Cintas Corporation Against EMCOR Group, Inc.
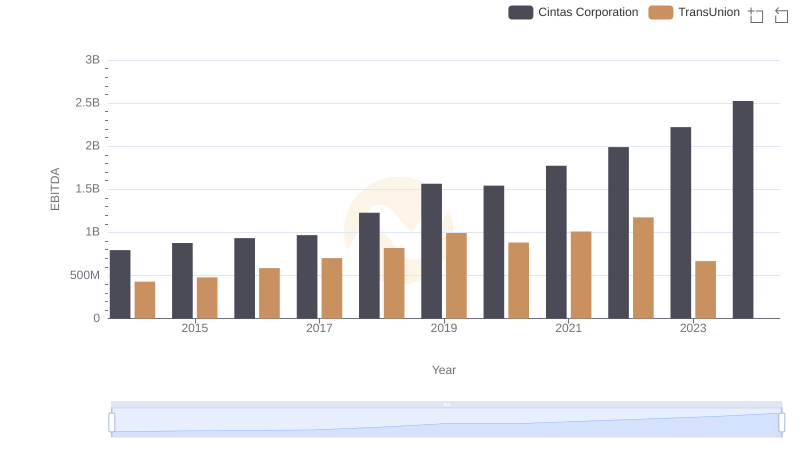
EBITDA Performance Review: Cintas Corporation vs TransUnion
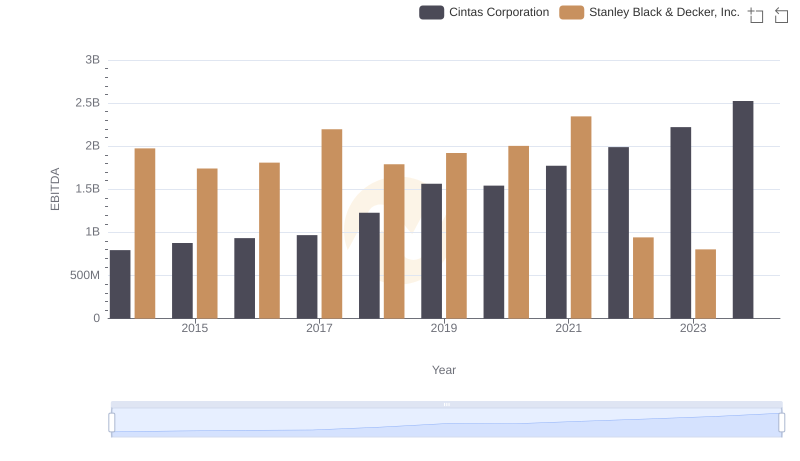
Cintas Corporation vs Stanley Black & Decker, Inc.: In-Depth EBITDA Performance Comparison