| __timestamp | Cintas Corporation | Dover Corporation |
|---|---|---|
| Wednesday, January 1, 2014 | 793811000 | 1533084000 |
| Thursday, January 1, 2015 | 877761000 | 1259375000 |
| Friday, January 1, 2016 | 933728000 | 1186472000 |
| Sunday, January 1, 2017 | 968293000 | 1304041000 |
| Monday, January 1, 2018 | 1227852000 | 1138930000 |
| Tuesday, January 1, 2019 | 1564228000 | 1241114000 |
| Wednesday, January 1, 2020 | 1542737000 | 1232722000 |
| Friday, January 1, 2021 | 1773591000 | 1797268000 |
| Saturday, January 1, 2022 | 1990046000 | 1711499000 |
| Sunday, January 1, 2023 | 2221676000 | 1718774000 |
| Monday, January 1, 2024 | 2523857000 | 1206355000 |
Data in motion
In the competitive landscape of corporate America, Cintas Corporation and Dover Corporation have showcased remarkable EBITDA growth over the past decade. Since 2014, Cintas has consistently outperformed, with its EBITDA surging by over 200% by 2023. This growth trajectory highlights Cintas's strategic prowess in the uniform and facility services sector.
Conversely, Dover Corporation, a diversified global manufacturer, experienced a more modest EBITDA increase of approximately 12% over the same period. Notably, Dover's EBITDA peaked in 2021, aligning with global economic recovery trends post-pandemic.
The data reveals a fascinating divergence in 2024, where Cintas's EBITDA continues its upward trend, while Dover's data remains unavailable, suggesting potential reporting delays or strategic shifts. This analysis underscores the importance of strategic agility and market adaptation in sustaining financial growth.
Explore the chart to delve deeper into these financial narratives and understand the dynamics shaping these industry leaders.
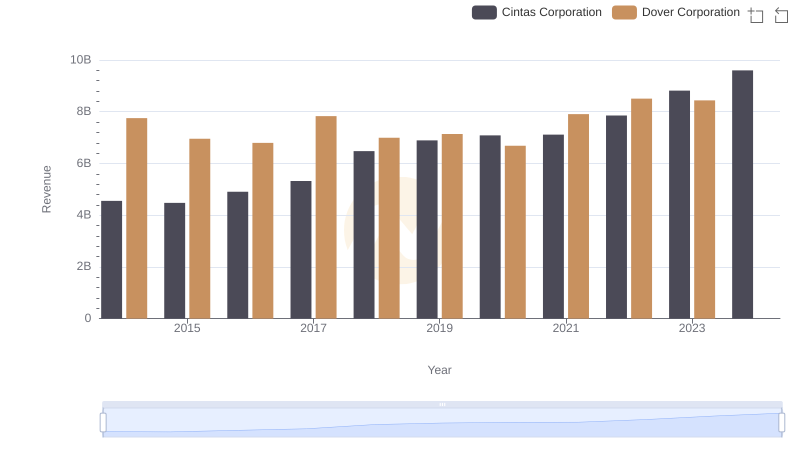
Revenue Insights: Cintas Corporation and Dover Corporation Performance Compared
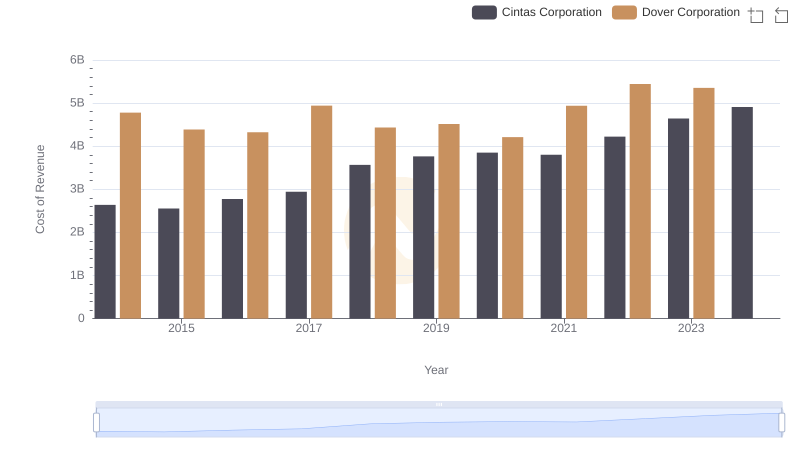
Cost of Revenue Trends: Cintas Corporation vs Dover Corporation
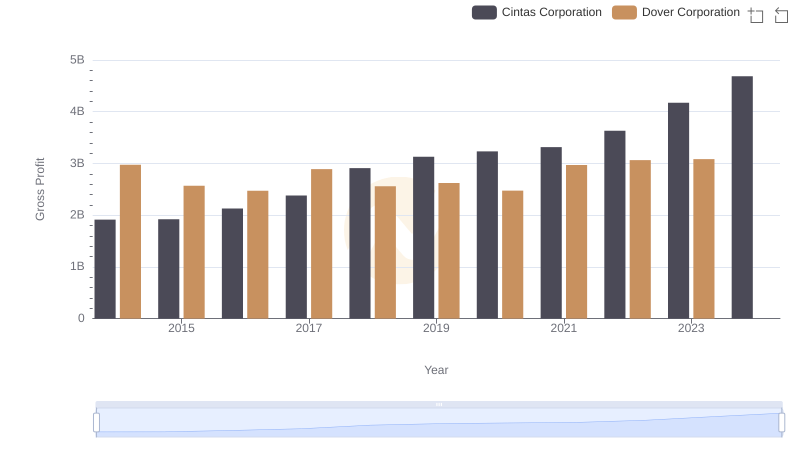
Gross Profit Analysis: Comparing Cintas Corporation and Dover Corporation
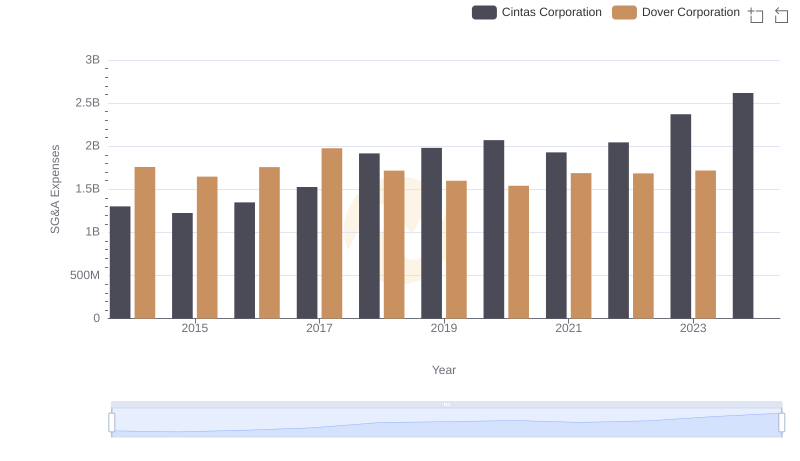
Cintas Corporation and Dover Corporation: SG&A Spending Patterns Compared
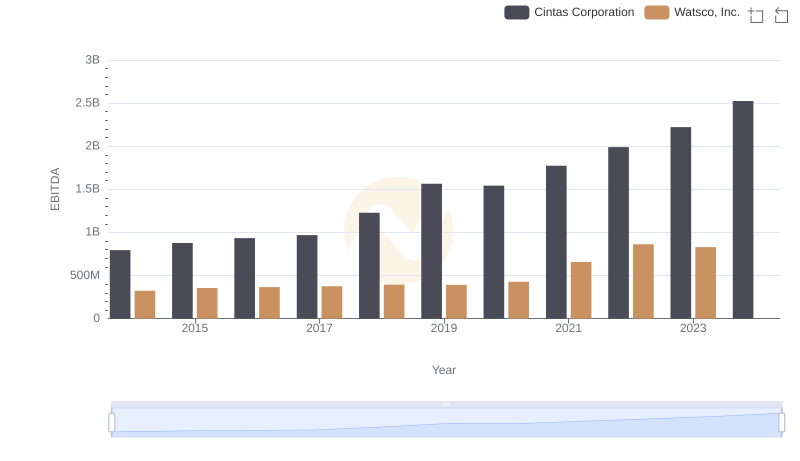
Cintas Corporation and Watsco, Inc.: A Detailed Examination of EBITDA Performance
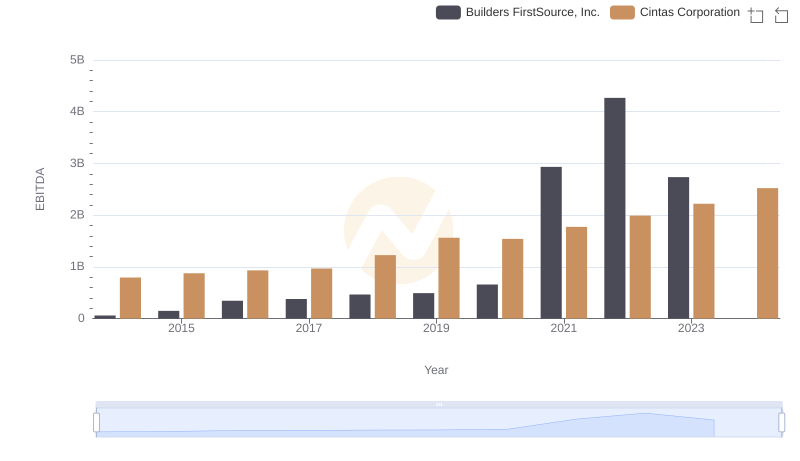
A Side-by-Side Analysis of EBITDA: Cintas Corporation and Builders FirstSource, Inc.
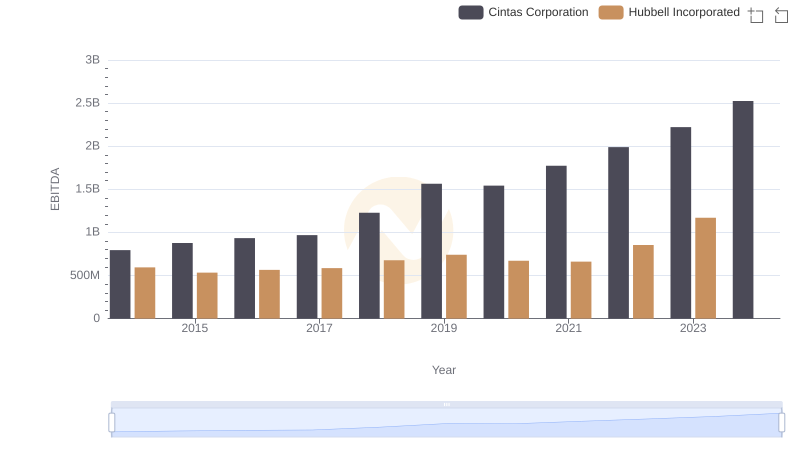
EBITDA Metrics Evaluated: Cintas Corporation vs Hubbell Incorporated
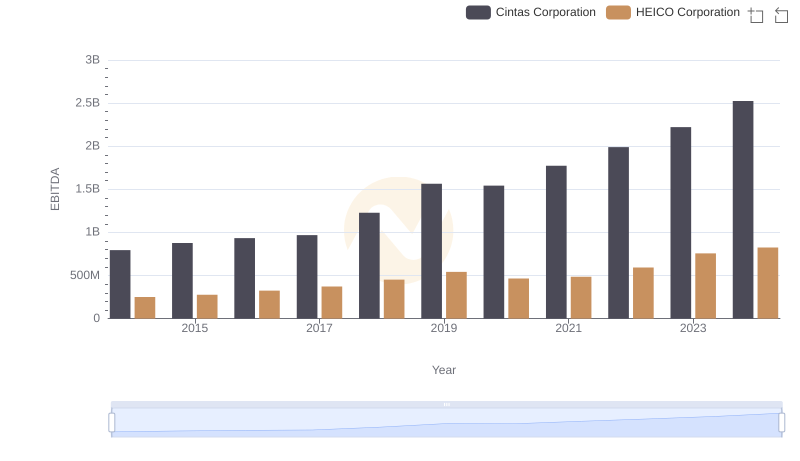
A Professional Review of EBITDA: Cintas Corporation Compared to HEICO Corporation
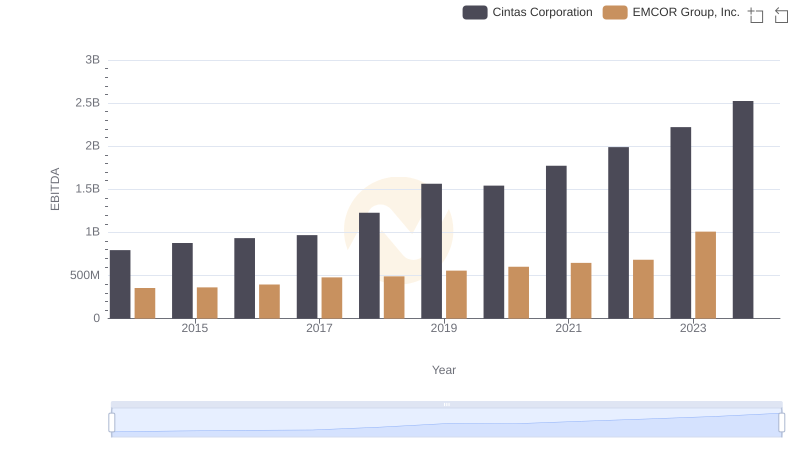
EBITDA Analysis: Evaluating Cintas Corporation Against EMCOR Group, Inc.
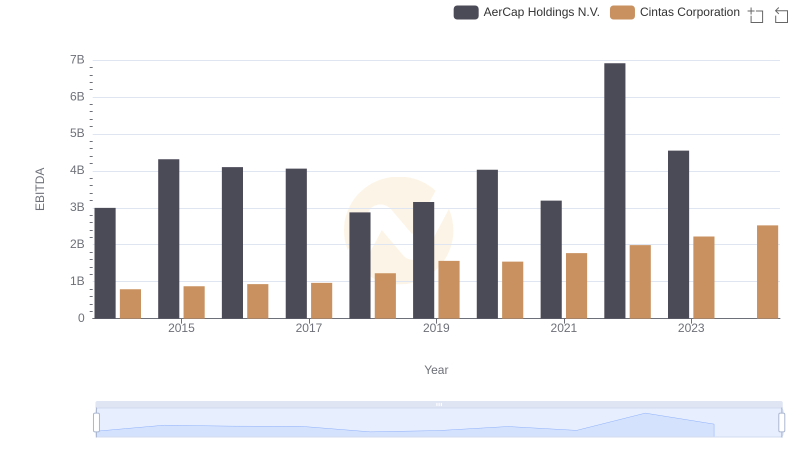
EBITDA Performance Review: Cintas Corporation vs AerCap Holdings N.V.
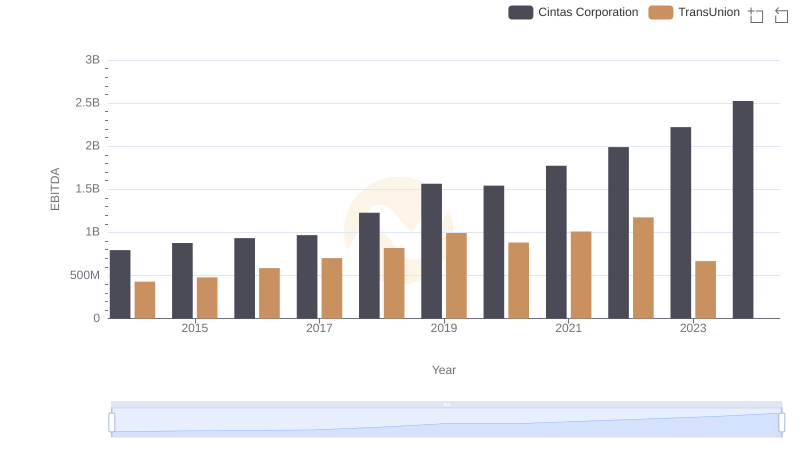
EBITDA Performance Review: Cintas Corporation vs TransUnion